29
/it/
it
AIzaSyAYiBZKx7MnpbEhh9jyipgxe19OcubqV5w
April 1, 2024
226051
Portugal
PRT
true
2
1
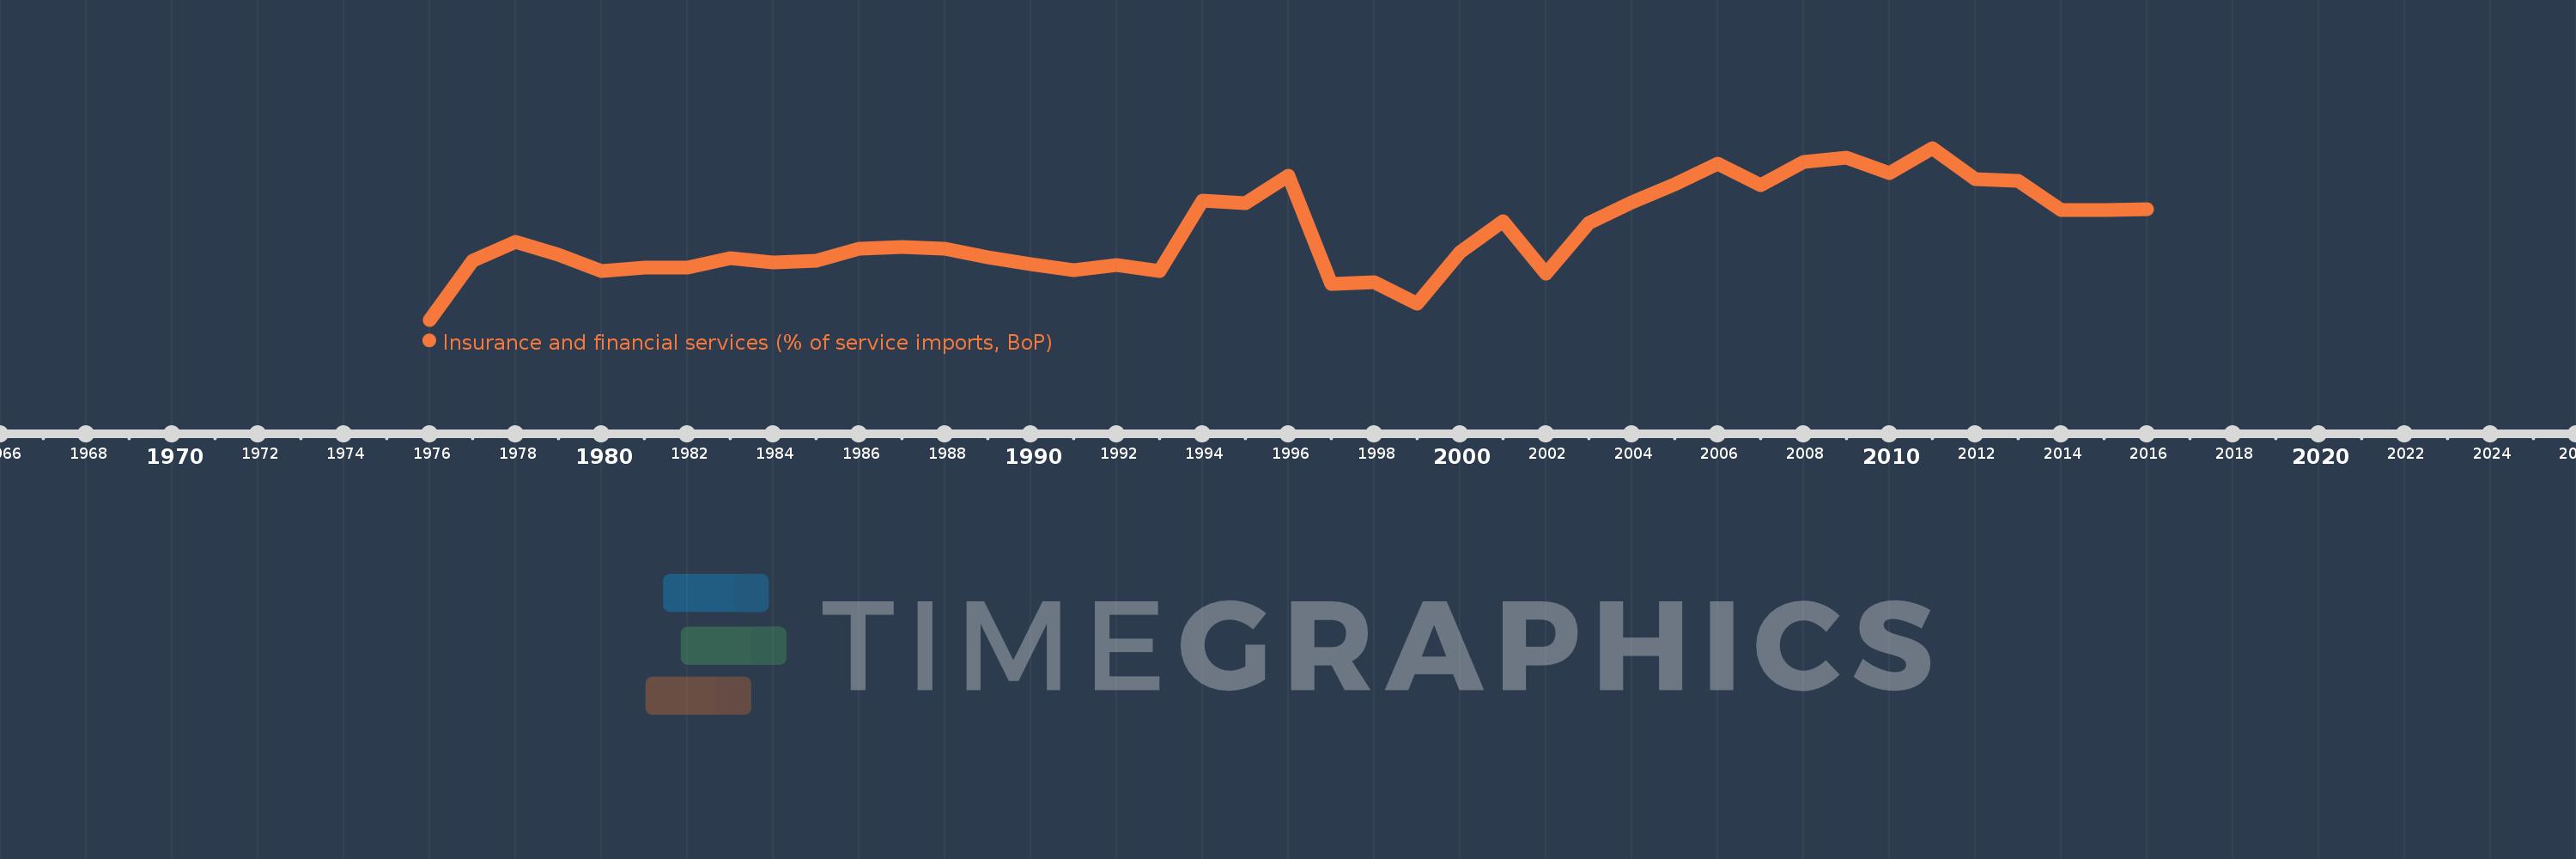
Insurance and financial services (% of service imports, BoP)
2016,2015,2014,2013,2012,2011,2010,2009,2008,2007,2006,2005,2004,2003,2002,2001,2000,1999,1998,1997,1996,1995,1994,1993,1992,1991,1990,1989,1988,1987,1986,1985,1984,1983,1982,1981,1980,1979,1978,1977,1976
Queste statistiche in altri paesi:
AfghanistanAlbaniaAlgeriaAngolaAntigua and BarbudaArab WorldArgentinaArmeniaArubaAustraliaAustriaAzerbaijanBahamas, TheBahrainBangladeshBarbadosBelarusBelgiumBelizeBeninBermudaBhutanBoliviaBosnia and HerzegovinaBotswanaBrazilBrunei DarussalamBulgariaBurkina FasoBurundiCabo VerdeCambodiaCameroonCanadaCaribbean small statesCentral African RepublicCentral Europe and the BalticsChadChileChinaColombiaComorosCongo, Dem. Rep.Congo, Rep.Costa RicaCote d'IvoireCroatiaCuracaoCyprusCzech RepublicDenmarkDjiboutiDominicaDominican RepublicEarly-demographic dividendEast Asia & PacificEast Asia & Pacific (excluding high income)East Asia & Pacific (IDA & IBRD countries)EcuadorEgypt, Arab Rep.El SalvadorEquatorial GuineaEritreaEstoniaEthiopiaEuro areaEurope & Central AsiaEurope & Central Asia (excluding high income)Europe & Central Asia (IDA & IBRD countries)European UnionFaroe IslandsFijiFinlandFragile and conflict affected situationsFranceFrench PolynesiaGabonGambia, TheGeorgiaGermanyGhanaGreeceGrenadaGuatemalaGuineaGuinea-BissauGuyanaHaitiHeavily indebted poor countries (HIPC)High incomeHondurasHong Kong SAR, ChinaHungaryIBRD onlyIcelandIDA & IBRD totalIDA onlyIDA totalIndiaIndonesiaIran, Islamic Rep.IraqIrelandIsraelItalyJamaicaJapanJordanKazakhstanKenyaKiribatiKorea, Rep.KosovoKuwaitKyrgyz RepublicLao PDRLate-demographic dividendLatin America & Caribbean Latin America & Caribbean (excluding high income)Latin America & the Caribbean (IDA & IBRD countries)LatviaLeast developed countries: UN classificationLebanonLesothoLiberiaLibyaLithuaniaLow & middle incomeLow incomeLower middle incomeLuxembourgMacao SAR, ChinaMacedonia, FYRMadagascarMalawiMalaysiaMaldivesMaliMaltaMarshall IslandsMauritaniaMauritiusMexicoMicronesia, Fed. Sts.Middle East & North AfricaMiddle East & North Africa (excluding high income)Middle East & North Africa (IDA & IBRD countries)Middle incomeMoldovaMongoliaMontenegroMoroccoMozambiqueMyanmarNamibiaNepalNetherlandsNew CaledoniaNew ZealandNicaraguaNigerNigeriaNorth AmericaNorwayOECD membersOmanOther small statesPacific island small statesPakistanPalauPanamaPapua New GuineaParaguayPeruPhilippinesPolandPortugalPost-demographic dividendPre-demographic dividendQatarRomaniaRussian FederationRwandaSamoaSao Tome and PrincipeSaudi ArabiaSenegalSerbiaSeychellesSierra LeoneSingaporeSint Maarten (Dutch part)Slovak RepublicSloveniaSmall statesSolomon IslandsSouth AfricaSouth AsiaSouth Asia (IDA & IBRD)South SudanSpainSri LankaSt. Kitts and NevisSt. LuciaSt. Vincent and the GrenadinesSub-Saharan Africa Sub-Saharan Africa (excluding high income)Sub-Saharan Africa (IDA & IBRD countries)SudanSurinameSwazilandSwedenSwitzerlandSyrian Arab RepublicTajikistanTanzaniaThailandTimor-LesteTogoTongaTrinidad and TobagoTunisiaTurkeyTuvaluUgandaUkraineUnited KingdomUnited StatesUpper middle incomeUruguayVanuatuVenezuela, RBWest Bank and GazaWorldYemen, Rep.ZambiaZimbabwe Linea del tempo:
Questa scala temporale mostra un grafico dal 1976 anno al 2016 anno. Portugal. I dati fino ad 1975 anno non disponibili. Il numero di osservazioni attuali secondo i date: 41.
La fonte (nome):
Indicatori dello sviluppo mondiale
La fonte (organizzazione):
International Monetary Fund, Balance of Payments Statistics Yearbook and data files.
Categorie:
Economy & Growth, Private Sector, Trade
sono stati aggiornati
23 apr 2017 anni
Indicatori delle variazioni dei valori per anni
Minima:
2.835
1 gen 1976 anni
Massimo:
9.699
1 gen 2011 anni
Alla data di osservazione
Valore
Variazione assoluta
La variazione rispetto al valore precedente
1 gen 1976 anni
2.835
+2.835
0.0%
1 gen 1977 anni
5.205
+2.37
83.61%
1 gen 1978 anni
5.958
+0.754
14.48%
1 gen 1979 anni
5.418
-0.54
-9.07%
1 gen 1980 anni
4.796
-0.622
-11.48%
1 gen 1981 anni
4.929
+0.133
2.77%
1 gen 1982 anni
4.914
-0.015
-0.31%
1 gen 1983 anni
5.291
+0.377
7.68%
1 gen 1984 anni
5.136
-0.155
-2.93%
1 gen 1985 anni
5.203
+0.066
1.29%
1 gen 1986 anni
5.663
+0.46
8.84%
1 gen 1987 anni
5.74
+0.078
1.37%
1 gen 1988 anni
5.662
-0.078
-1.36%
1 gen 1989 anni
5.323
-0.339
-5.99%
1 gen 1990 anni
5.052
-0.271
-5.09%
1 gen 1991 anni
4.825
-0.227
-4.49%
1 gen 1992 anni
5.038
+0.213
4.42%
1 gen 1993 anni
4.798
-0.24
-4.77%
1 gen 1994 anni
7.597
+2.799
58.33%
1 gen 1995 anni
7.482
-0.114
-1.51%
1 gen 1996 anni
8.578
+1.095
14.64%
1 gen 1997 anni
4.262
-4.315
-50.31%
1 gen 1998 anni
4.349
+0.086
2.02%
1 gen 1999 anni
3.481
-0.868
-19.95%
1 gen 2000 anni
5.524
+2.043
58.69%
1 gen 2001 anni
6.78
+1.256
22.73%
1 gen 2002 anni
4.671
-2.109
-31.1%
1 gen 2003 anni
6.713
+2.042
43.72%
1 gen 2004 anni
7.516
+0.803
11.96%
1 gen 2005 anni
8.256
+0.74
9.84%
1 gen 2006 anni
9.054
+0.798
9.67%
1 gen 2007 anni
8.211
-0.843
-9.31%
1 gen 2008 anni
9.15
+0.938
11.43%
1 gen 2009 anni
9.313
+0.163
1.79%
1 gen 2010 anni
8.693
-0.62
-6.65%
1 gen 2011 anni
9.699
+1.005
11.56%
1 gen 2012 anni
8.45
-1.248
-12.87%
1 gen 2013 anni
8.39
-0.06
-0.72%
1 gen 2014 anni
7.205
-1.184
-14.12%
1 gen 2015 anni
7.217
+0.012
0.17%
1 gen 2016 anni
7.268
+0.051
0.7%
Classificazione dei paesi secondo i statistiche attuali per anni


Commenti: