29
/it/
it
AIzaSyAYiBZKx7MnpbEhh9jyipgxe19OcubqV5w
April 1, 2024
167656
Kenya
KEN
true
2
1
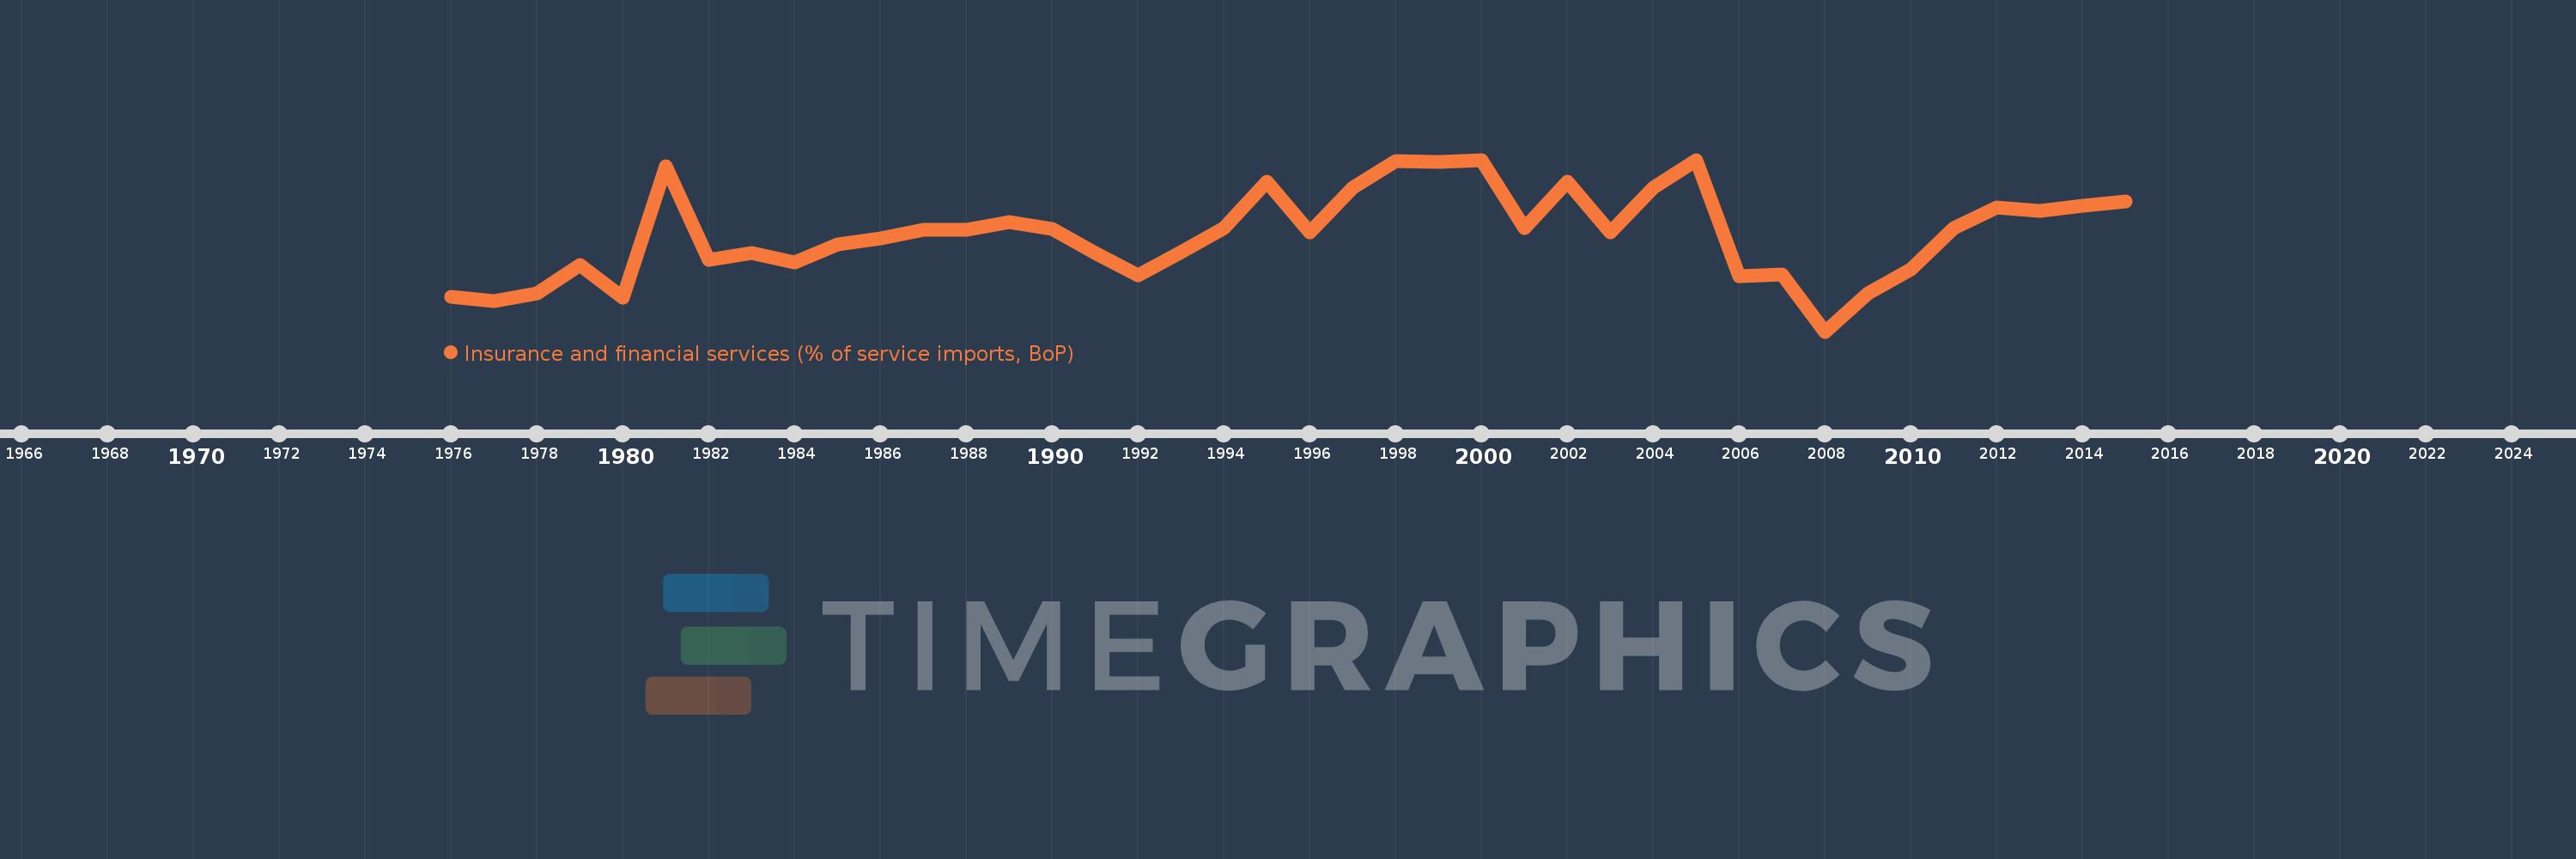
Insurance and financial services (% of service imports, BoP)
2015,2014,2013,2012,2011,2010,2009,2008,2007,2006,2005,2004,2003,2002,2001,2000,1999,1998,1997,1996,1995,1994,1993,1992,1991,1990,1989,1988,1987,1986,1985,1984,1983,1982,1981,1980,1979,1978,1977,1976
Queste statistiche in altri paesi:
AfghanistanAlbaniaAlgeriaAngolaAntigua and BarbudaArab WorldArgentinaArmeniaArubaAustraliaAustriaAzerbaijanBahamas, TheBahrainBangladeshBarbadosBelarusBelgiumBelizeBeninBermudaBhutanBoliviaBosnia and HerzegovinaBotswanaBrazilBrunei DarussalamBulgariaBurkina FasoBurundiCabo VerdeCambodiaCameroonCanadaCaribbean small statesCentral African RepublicCentral Europe and the BalticsChadChileChinaColombiaComorosCongo, Dem. Rep.Congo, Rep.Costa RicaCote d'IvoireCroatiaCuracaoCyprusCzech RepublicDenmarkDjiboutiDominicaDominican RepublicEarly-demographic dividendEast Asia & PacificEast Asia & Pacific (excluding high income)East Asia & Pacific (IDA & IBRD countries)EcuadorEgypt, Arab Rep.El SalvadorEquatorial GuineaEritreaEstoniaEthiopiaEuro areaEurope & Central AsiaEurope & Central Asia (excluding high income)Europe & Central Asia (IDA & IBRD countries)European UnionFaroe IslandsFijiFinlandFragile and conflict affected situationsFranceFrench PolynesiaGabonGambia, TheGeorgiaGermanyGhanaGreeceGrenadaGuatemalaGuineaGuinea-BissauGuyanaHaitiHeavily indebted poor countries (HIPC)High incomeHondurasHong Kong SAR, ChinaHungaryIBRD onlyIcelandIDA & IBRD totalIDA onlyIDA totalIndiaIndonesiaIran, Islamic Rep.IraqIrelandIsraelItalyJamaicaJapanJordanKazakhstanKenyaKiribatiKorea, Rep.KosovoKuwaitKyrgyz RepublicLao PDRLate-demographic dividendLatin America & Caribbean Latin America & Caribbean (excluding high income)Latin America & the Caribbean (IDA & IBRD countries)LatviaLeast developed countries: UN classificationLebanonLesothoLiberiaLibyaLithuaniaLow & middle incomeLow incomeLower middle incomeLuxembourgMacao SAR, ChinaMacedonia, FYRMadagascarMalawiMalaysiaMaldivesMaliMaltaMarshall IslandsMauritaniaMauritiusMexicoMicronesia, Fed. Sts.Middle East & North AfricaMiddle East & North Africa (excluding high income)Middle East & North Africa (IDA & IBRD countries)Middle incomeMoldovaMongoliaMontenegroMoroccoMozambiqueMyanmarNamibiaNepalNetherlandsNew CaledoniaNew ZealandNicaraguaNigerNigeriaNorth AmericaNorwayOECD membersOmanOther small statesPacific island small statesPakistanPalauPanamaPapua New GuineaParaguayPeruPhilippinesPolandPortugalPost-demographic dividendPre-demographic dividendQatarRomaniaRussian FederationRwandaSamoaSao Tome and PrincipeSaudi ArabiaSenegalSerbiaSeychellesSierra LeoneSingaporeSint Maarten (Dutch part)Slovak RepublicSloveniaSmall statesSolomon IslandsSouth AfricaSouth AsiaSouth Asia (IDA & IBRD)South SudanSpainSri LankaSt. Kitts and NevisSt. LuciaSt. Vincent and the GrenadinesSub-Saharan Africa Sub-Saharan Africa (excluding high income)Sub-Saharan Africa (IDA & IBRD countries)SudanSurinameSwazilandSwedenSwitzerlandSyrian Arab RepublicTajikistanTanzaniaThailandTimor-LesteTogoTongaTrinidad and TobagoTunisiaTurkeyTuvaluUgandaUkraineUnited KingdomUnited StatesUpper middle incomeUruguayVanuatuVenezuela, RBWest Bank and GazaWorldYemen, Rep.ZambiaZimbabwe Linea del tempo:
Questa scala temporale mostra un grafico dal 1976 anno al 2015 anno. Kenya. I dati fino ad 1975 anno non disponibili. Il numero di osservazioni attuali secondo i date: 40.
La fonte (nome):
Indicatori dello sviluppo mondiale
La fonte (organizzazione):
International Monetary Fund, Balance of Payments Statistics Yearbook and data files.
Categorie:
Economy & Growth, Private Sector, Trade
sono stati aggiornati
23 apr 2017 anni
Indicatori delle variazioni dei valori per anni
Minima:
4.414
1 gen 2008 anni
Massimo:
11.406
1 gen 2000 anni
Alla data di osservazione
Valore
Variazione assoluta
La variazione rispetto al valore precedente
1 gen 1976 anni
5.835
+5.835
0.0%
1 gen 1977 anni
5.659
-0.176
-3.01%
1 gen 1978 anni
5.956
+0.297
5.25%
1 gen 1979 anni
7.131
+1.174
19.72%
1 gen 1980 anni
5.794
-1.337
-18.75%
1 gen 1981 anni
11.155
+5.361
92.53%
1 gen 1982 anni
7.346
-3.81
-34.15%
1 gen 1983 anni
7.607
+0.262
3.56%
1 gen 1984 anni
7.235
-0.373
-4.9%
1 gen 1985 anni
7.954
+0.719
9.93%
1 gen 1986 anni
8.209
+0.256
3.21%
1 gen 1987 anni
8.571
+0.361
4.4%
1 gen 1988 anni
8.542
-0.029
-0.34%
1 gen 1989 anni
8.856
+0.314
3.68%
1 gen 1990 anni
8.59
-0.266
-3.01%
1 gen 1991 anni
7.607
-0.982
-11.43%
1 gen 1992 anni
6.719
-0.888
-11.68%
1 gen 1993 anni
7.663
+0.944
14.05%
1 gen 1994 anni
8.622
+0.959
12.51%
1 gen 1995 anni
10.509
+1.887
21.88%
1 gen 1996 anni
8.447
-2.062
-19.62%
1 gen 1997 anni
10.285
+1.838
21.76%
1 gen 1998 anni
11.362
+1.077
10.47%
1 gen 1999 anni
11.31
-0.053
-0.46%
1 gen 2000 anni
11.406
+0.096
0.85%
1 gen 2001 anni
8.622
-2.783
-24.4%
1 gen 2002 anni
10.509
+1.887
21.88%
1 gen 2003 anni
8.447
-2.062
-19.62%
1 gen 2004 anni
10.285
+1.838
21.76%
1 gen 2005 anni
11.398
+1.113
10.82%
1 gen 2006 anni
6.66
-4.738
-41.57%
1 gen 2007 anni
6.754
+0.094
1.41%
1 gen 2008 anni
4.414
-2.34
-34.65%
1 gen 2009 anni
5.956
+1.542
34.93%
1 gen 2010 anni
6.953
+0.997
16.74%
1 gen 2011 anni
8.62
+1.667
23.98%
1 gen 2012 anni
9.462
+0.842
9.77%
1 gen 2013 anni
9.316
-0.146
-1.55%
1 gen 2014 anni
9.545
+0.229
2.46%
1 gen 2015 anni
9.697
+0.152
1.6%
Classificazione dei paesi secondo i statistiche attuali per anni


Commenti: