29
/it/
it
AIzaSyAYiBZKx7MnpbEhh9jyipgxe19OcubqV5w
April 1, 2024
141958
Greece
GRC
true
2
1
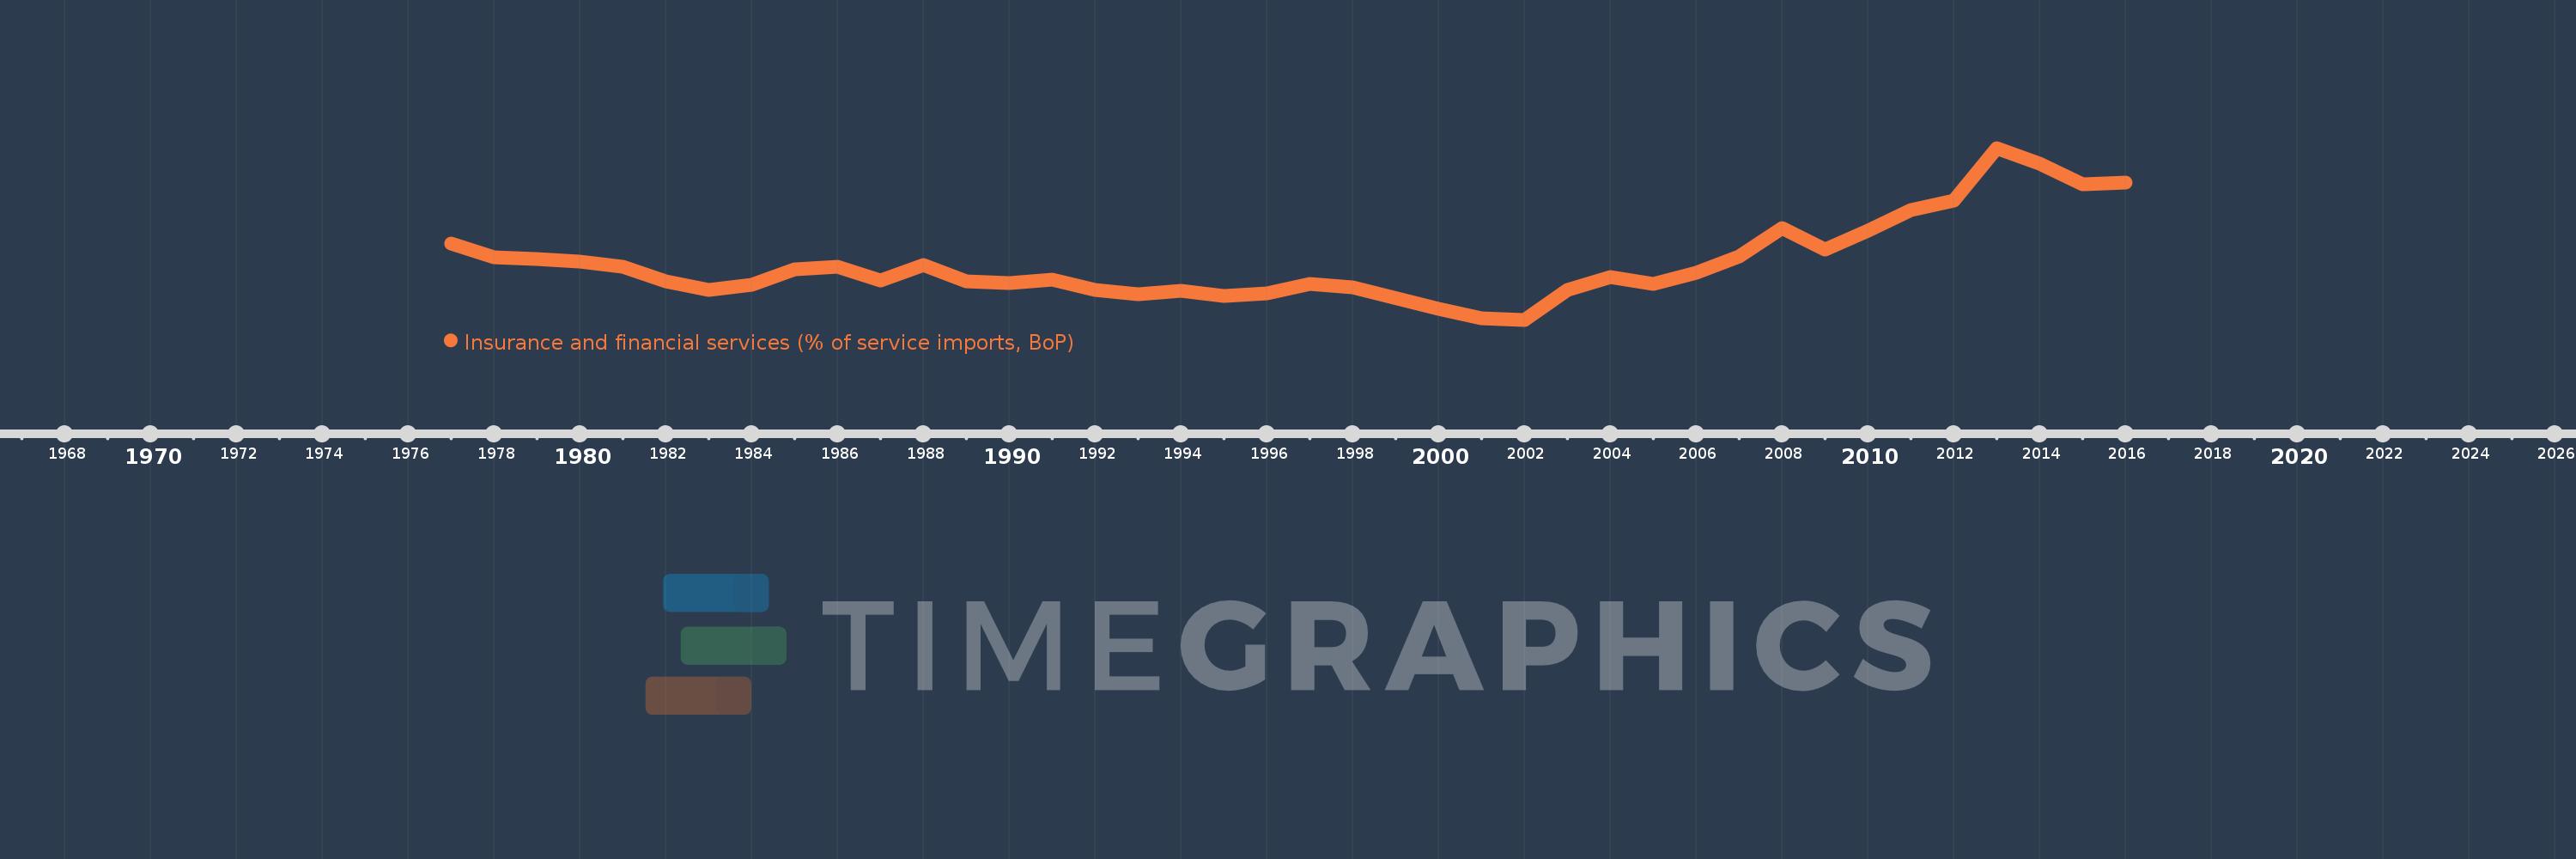
Insurance and financial services (% of service imports, BoP)
2016,2015,2014,2013,2012,2011,2010,2009,2008,2007,2006,2005,2004,2003,2002,2001,2000,1998,1997,1996,1995,1994,1993,1992,1991,1990,1989,1988,1987,1986,1985,1984,1983,1982,1981,1980,1979,1978,1977
Queste statistiche in altri paesi:
AfghanistanAlbaniaAlgeriaAngolaAntigua and BarbudaArab WorldArgentinaArmeniaArubaAustraliaAustriaAzerbaijanBahamas, TheBahrainBangladeshBarbadosBelarusBelgiumBelizeBeninBermudaBhutanBoliviaBosnia and HerzegovinaBotswanaBrazilBrunei DarussalamBulgariaBurkina FasoBurundiCabo VerdeCambodiaCameroonCanadaCaribbean small statesCentral African RepublicCentral Europe and the BalticsChadChileChinaColombiaComorosCongo, Dem. Rep.Congo, Rep.Costa RicaCote d'IvoireCroatiaCuracaoCyprusCzech RepublicDenmarkDjiboutiDominicaDominican RepublicEarly-demographic dividendEast Asia & PacificEast Asia & Pacific (excluding high income)East Asia & Pacific (IDA & IBRD countries)EcuadorEgypt, Arab Rep.El SalvadorEquatorial GuineaEritreaEstoniaEthiopiaEuro areaEurope & Central AsiaEurope & Central Asia (excluding high income)Europe & Central Asia (IDA & IBRD countries)European UnionFaroe IslandsFijiFinlandFragile and conflict affected situationsFranceFrench PolynesiaGabonGambia, TheGeorgiaGermanyGhanaGreeceGrenadaGuatemalaGuineaGuinea-BissauGuyanaHaitiHeavily indebted poor countries (HIPC)High incomeHondurasHong Kong SAR, ChinaHungaryIBRD onlyIcelandIDA & IBRD totalIDA onlyIDA totalIndiaIndonesiaIran, Islamic Rep.IraqIrelandIsraelItalyJamaicaJapanJordanKazakhstanKenyaKiribatiKorea, Rep.KosovoKuwaitKyrgyz RepublicLao PDRLate-demographic dividendLatin America & Caribbean Latin America & Caribbean (excluding high income)Latin America & the Caribbean (IDA & IBRD countries)LatviaLeast developed countries: UN classificationLebanonLesothoLiberiaLibyaLithuaniaLow & middle incomeLow incomeLower middle incomeLuxembourgMacao SAR, ChinaMacedonia, FYRMadagascarMalawiMalaysiaMaldivesMaliMaltaMarshall IslandsMauritaniaMauritiusMexicoMicronesia, Fed. Sts.Middle East & North AfricaMiddle East & North Africa (excluding high income)Middle East & North Africa (IDA & IBRD countries)Middle incomeMoldovaMongoliaMontenegroMoroccoMozambiqueMyanmarNamibiaNepalNetherlandsNew CaledoniaNew ZealandNicaraguaNigerNigeriaNorth AmericaNorwayOECD membersOmanOther small statesPacific island small statesPakistanPalauPanamaPapua New GuineaParaguayPeruPhilippinesPolandPortugalPost-demographic dividendPre-demographic dividendQatarRomaniaRussian FederationRwandaSamoaSao Tome and PrincipeSaudi ArabiaSenegalSerbiaSeychellesSierra LeoneSingaporeSint Maarten (Dutch part)Slovak RepublicSloveniaSmall statesSolomon IslandsSouth AfricaSouth AsiaSouth Asia (IDA & IBRD)South SudanSpainSri LankaSt. Kitts and NevisSt. LuciaSt. Vincent and the GrenadinesSub-Saharan Africa Sub-Saharan Africa (excluding high income)Sub-Saharan Africa (IDA & IBRD countries)SudanSurinameSwazilandSwedenSwitzerlandSyrian Arab RepublicTajikistanTanzaniaThailandTimor-LesteTogoTongaTrinidad and TobagoTunisiaTurkeyTuvaluUgandaUkraineUnited KingdomUnited StatesUpper middle incomeUruguayVanuatuVenezuela, RBWest Bank and GazaWorldYemen, Rep.ZambiaZimbabwe Linea del tempo:
Questa scala temporale mostra un grafico dal 1977 anno al 2016 anno. Greece. I dati fino ad 1976 anno non disponibili. Il numero di osservazioni attuali secondo i date: 39.
La fonte (nome):
Indicatori dello sviluppo mondiale
La fonte (organizzazione):
International Monetary Fund, Balance of Payments Statistics Yearbook and data files.
Categorie:
Economy & Growth, Private Sector, Trade
sono stati aggiornati
23 apr 2017 anni
Indicatori delle variazioni dei valori per anni
Minima:
2.524
1 gen 2002 anni
Massimo:
13.116
1 gen 2013 anni
Alla data di osservazione
Valore
Variazione assoluta
La variazione rispetto al valore precedente
1 gen 1977 anni
7.238
+7.238
0.0%
1 gen 1978 anni
6.393
-0.845
-11.67%
1 gen 1979 anni
6.294
-0.099
-1.55%
1 gen 1980 anni
6.116
-0.178
-2.83%
1 gen 1981 anni
5.812
-0.304
-4.97%
1 gen 1982 anni
4.884
-0.929
-15.98%
1 gen 1983 anni
4.353
-0.53
-10.86%
1 gen 1984 anni
4.678
+0.324
7.45%
1 gen 1985 anni
5.653
+0.976
20.86%
1 gen 1986 anni
5.782
+0.128
2.27%
1 gen 1987 anni
4.956
-0.826
-14.29%
1 gen 1988 anni
5.91
+0.954
19.25%
1 gen 1989 anni
4.898
-1.011
-17.11%
1 gen 1990 anni
4.762
-0.136
-2.79%
1 gen 1991 anni
5.0
+0.238
5.0%
1 gen 1992 anni
4.384
-0.616
-12.31%
1 gen 1993 anni
4.107
-0.277
-6.33%
1 gen 1994 anni
4.289
+0.182
4.42%
1 gen 1995 anni
4.001
-0.287
-6.7%
1 gen 1996 anni
4.167
+0.166
4.14%
1 gen 1997 anni
4.743
+0.576
13.83%
1 gen 1998 anni
4.538
-0.205
-4.33%
1 gen 2000 anni
3.18
-1.358
-29.93%
1 gen 2001 anni
2.595
-0.585
-18.4%
1 gen 2002 anni
2.524
-0.07
-2.72%
1 gen 2003 anni
4.372
+1.848
73.21%
1 gen 2004 anni
5.131
+0.758
17.35%
1 gen 2005 anni
4.752
-0.379
-7.38%
1 gen 2006 anni
5.419
+0.667
14.04%
1 gen 2007 anni
6.422
+1.003
18.5%
1 gen 2008 anni
8.175
+1.753
27.3%
1 gen 2009 anni
6.869
-1.306
-15.98%
1 gen 2010 anni
8.033
+1.164
16.95%
1 gen 2011 anni
9.308
+1.275
15.87%
1 gen 2012 anni
9.844
+0.536
5.76%
1 gen 2013 anni
13.116
+3.272
33.24%
1 gen 2014 anni
12.137
-0.979
-7.47%
1 gen 2015 anni
10.883
-1.254
-10.33%
1 gen 2016 anni
10.97
+0.087
0.8%
Classificazione dei paesi secondo i statistiche attuali per anni


Commenti: