29
/it/
it
AIzaSyAYiBZKx7MnpbEhh9jyipgxe19OcubqV5w
April 1, 2024
245835
South Africa
ZAF
true
2
1
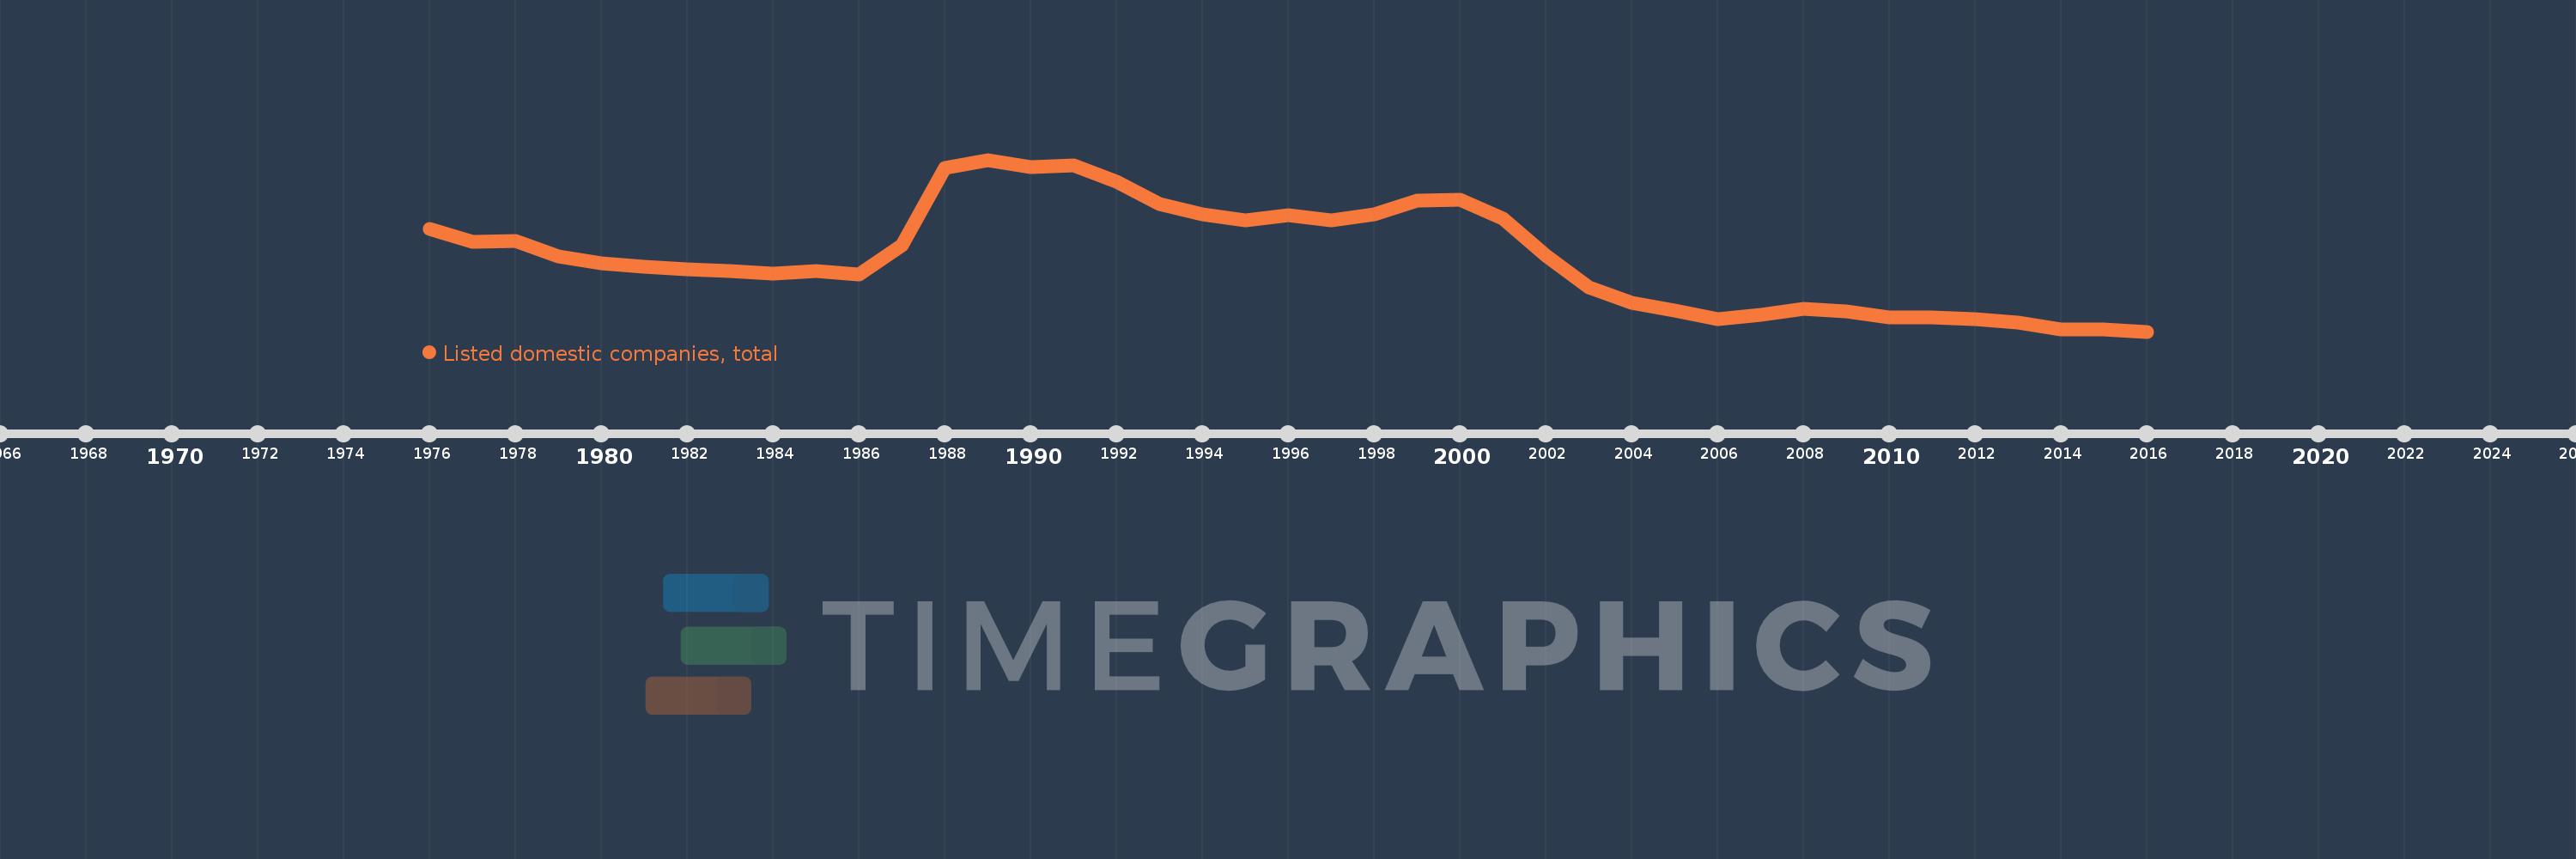
Listed domestic companies, total
2016,2015,2014,2013,2012,2011,2010,2009,2008,2007,2006,2005,2004,2003,2002,2001,2000,1999,1998,1997,1996,1995,1994,1993,1992,1991,1990,1989,1988,1987,1986,1985,1984,1983,1982,1981,1980,1979,1978,1977,1976
Queste statistiche in altri paesi:
Linea del tempo:
Questa scala temporale mostra un grafico dal 1976 anno al 2016 anno. South Africa. I dati fino ad 1975 anno non disponibili. Il numero di osservazioni attuali secondo i date: 41.
La fonte (nome):
Indicatori dello sviluppo mondiale
La fonte (organizzazione):
World Federation of Exchanges database.
Categorie:
Financial Sector
sono stati aggiornati
23 apr 2017 anni
Indicatori delle variazioni dei valori per anni
Minima:
316.0
1 gen 2016 anni
Massimo:
754.0
1 gen 1989 anni
Alla data di osservazione
Valore
Variazione assoluta
La variazione rispetto al valore precedente
1 gen 1976 anni
577.0
+577.0
0.0%
1 gen 1977 anni
545.0
-32.0
-5.55%
1 gen 1978 anni
547.0
+2.0
0.37%
1 gen 1979 anni
507.0
-40.0
-7.31%
1 gen 1980 anni
491.0
-16.0
-3.16%
1 gen 1981 anni
481.0
-10.0
-2.04%
1 gen 1982 anni
475.0
-6.0
-1.25%
1 gen 1983 anni
470.0
-5.0
-1.05%
1 gen 1984 anni
464.0
-6.0
-1.28%
1 gen 1985 anni
470.0
+6.0
1.29%
1 gen 1986 anni
462.0
-8.0
-1.7%
1 gen 1987 anni
536.0
+74.0
16.02%
1 gen 1988 anni
734.0
+198.0
36.94%
1 gen 1989 anni
754.0
+20.0
2.72%
1 gen 1990 anni
736.0
-18.0
-2.39%
1 gen 1991 anni
740.0
+4.0
0.54%
1 gen 1992 anni
698.0
-42.0
-5.68%
1 gen 1993 anni
642.0
-56.0
-8.02%
1 gen 1994 anni
615.0
-27.0
-4.21%
1 gen 1995 anni
600.0
-15.0
-2.44%
1 gen 1996 anni
612.0
+12.0
2.0%
1 gen 1997 anni
599.0
-13.0
-2.12%
1 gen 1998 anni
615.0
+16.0
2.67%
1 gen 1999 anni
650.0
+35.0
5.69%
1 gen 2000 anni
652.0
+2.0
0.31%
1 gen 2001 anni
604.0
-48.0
-7.36%
1 gen 2002 anni
510.0
-94.0
-15.56%
1 gen 2003 anni
429.0
-81.0
-15.88%
1 gen 2004 anni
390.0
-39.0
-9.09%
1 gen 2005 anni
369.0
-21.0
-5.38%
1 gen 2006 anni
348.0
-21.0
-5.69%
1 gen 2007 anni
359.0
+11.0
3.16%
1 gen 2008 anni
374.0
+15.0
4.18%
1 gen 2009 anni
367.0
-7.0
-1.87%
1 gen 2010 anni
353.0
-14.0
-3.81%
1 gen 2011 anni
352.0
-1.0
-0.28%
1 gen 2012 anni
347.0
-5.0
-1.42%
1 gen 2013 anni
338.0
-9.0
-2.59%
1 gen 2014 anni
322.0
-16.0
-4.73%
1 gen 2015 anni
322.0
0.0
0.0%
1 gen 2016 anni
316.0
-6.0
-1.86%
Classificazione dei paesi secondo i statistiche attuali per anni


Commenti: