29
/it/
it
AIzaSyAYiBZKx7MnpbEhh9jyipgxe19OcubqV5w
April 1, 2024
156235
Indonesia
IDN
true
2
1
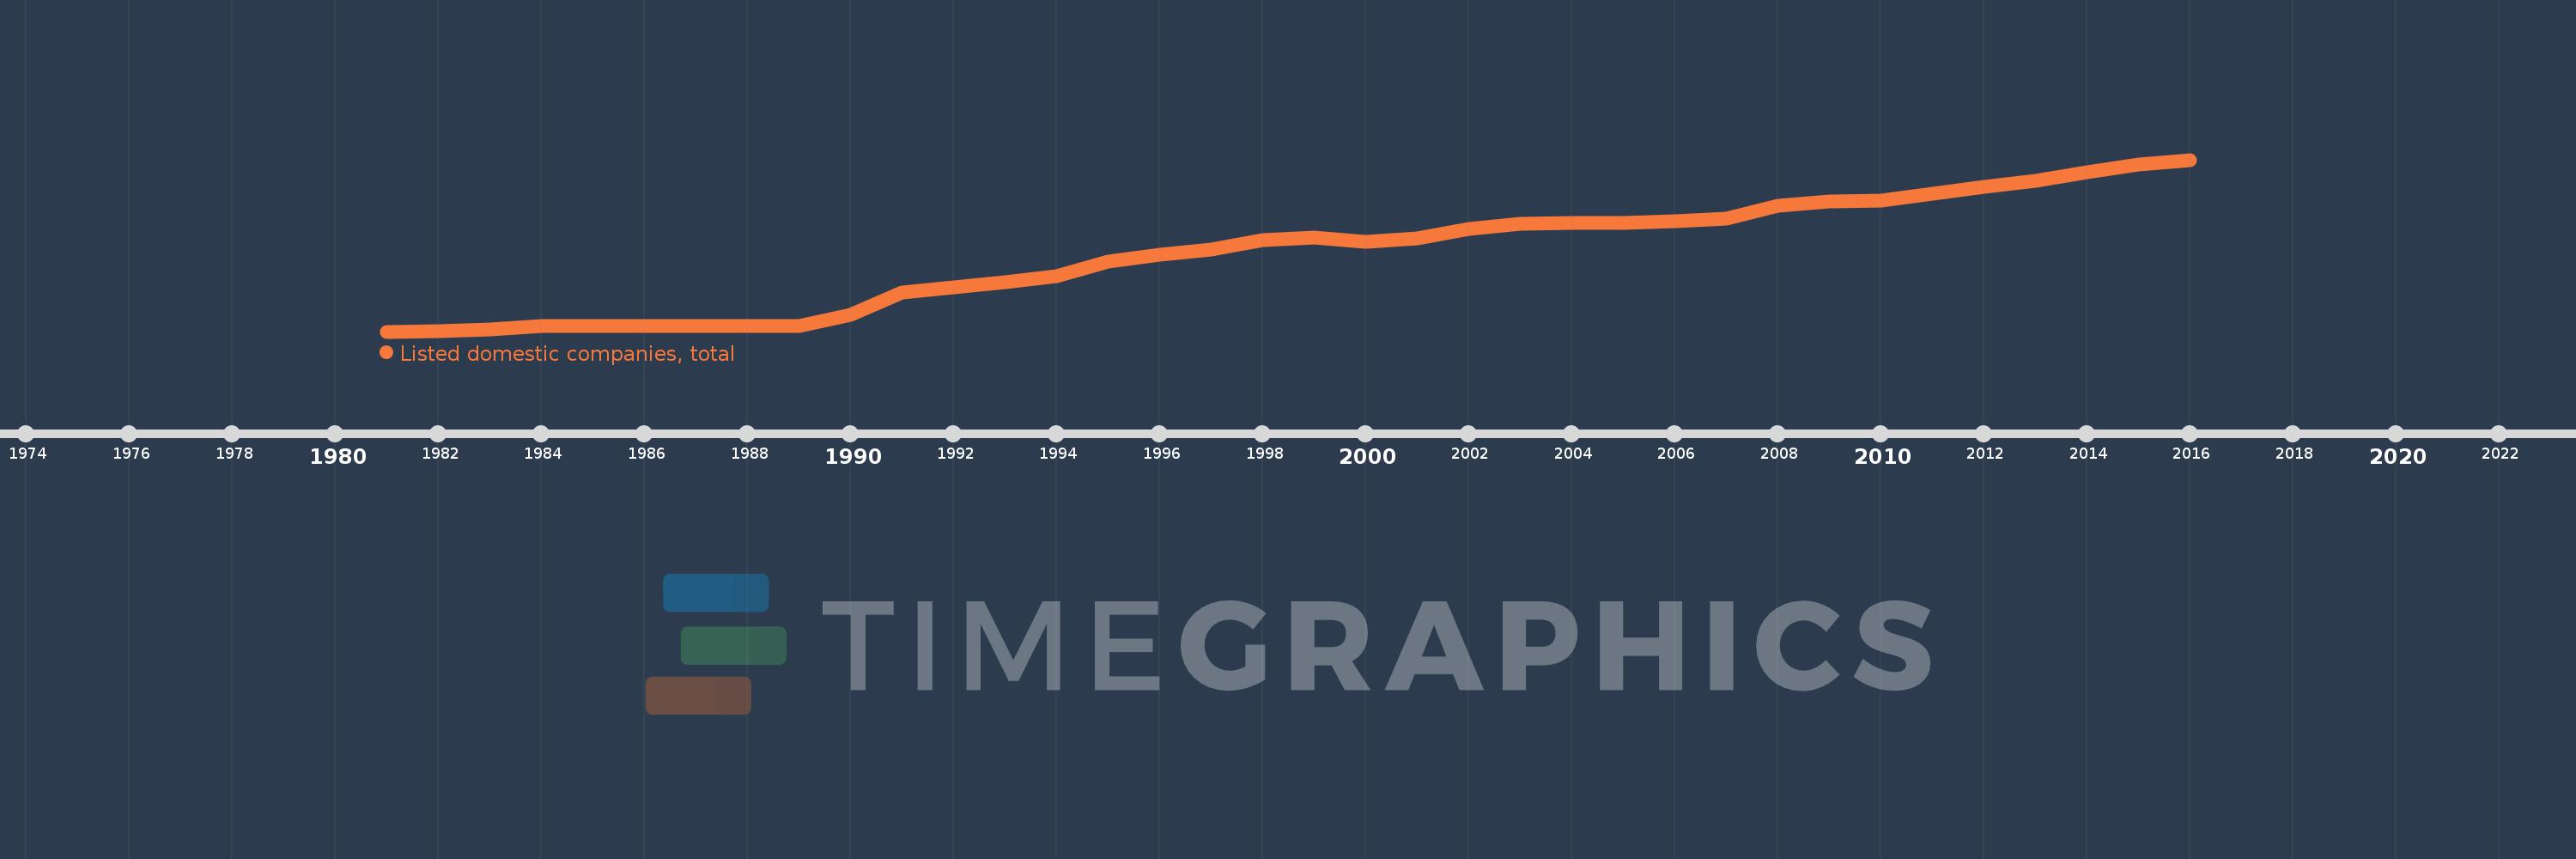
Listed domestic companies, total
2016,2015,2014,2013,2012,2011,2010,2009,2008,2007,2006,2005,2004,2003,2002,2001,2000,1999,1998,1997,1996,1995,1994,1993,1992,1991,1990,1989,1988,1987,1986,1985,1984,1983,1982,1981
Queste statistiche in altri paesi:
Linea del tempo:
Questa scala temporale mostra un grafico dal 1981 anno al 2016 anno. Indonesia. I dati fino ad 1980 anno non disponibili. Il numero di osservazioni attuali secondo i date: 36.
La fonte (nome):
Indicatori dello sviluppo mondiale
La fonte (organizzazione):
World Federation of Exchanges database.
Categorie:
Financial Sector
sono stati aggiornati
23 apr 2017 anni
Indicatori delle variazioni dei valori per anni
Minima:
6.0
1 gen 1981 anni
Massimo:
521.0
1 gen 2016 anni
Alla data di osservazione
Valore
Variazione assoluta
La variazione rispetto al valore precedente
1 gen 1981 anni
6.0
+6.0
0.0%
1 gen 1982 anni
8.0
+2.0
33.33%
1 gen 1983 anni
13.0
+5.0
62.5%
1 gen 1984 anni
23.0
+10.0
76.92%
1 gen 1985 anni
24.0
+1.0
4.35%
1 gen 1986 anni
24.0
0.0
0.0%
1 gen 1987 anni
24.0
0.0
0.0%
1 gen 1988 anni
24.0
0.0
0.0%
1 gen 1989 anni
24.0
0.0
0.0%
1 gen 1990 anni
57.0
+33.0
137.5%
1 gen 1991 anni
123.0
+66.0
115.79%
1 gen 1992 anni
139.0
+16.0
13.01%
1 gen 1993 anni
153.0
+14.0
10.07%
1 gen 1994 anni
172.0
+19.0
12.42%
1 gen 1995 anni
217.0
+45.0
26.16%
1 gen 1996 anni
237.0
+20.0
9.22%
1 gen 1997 anni
252.0
+15.0
6.33%
1 gen 1998 anni
281.0
+29.0
11.51%
1 gen 1999 anni
287.0
+6.0
2.14%
1 gen 2000 anni
276.0
-11.0
-3.83%
1 gen 2001 anni
286.0
+10.0
3.62%
1 gen 2002 anni
315.0
+29.0
10.14%
1 gen 2003 anni
330.0
+15.0
4.76%
1 gen 2004 anni
333.0
+3.0
0.91%
1 gen 2005 anni
331.0
-2.0
-0.6%
1 gen 2006 anni
336.0
+5.0
1.51%
1 gen 2007 anni
344.0
+8.0
2.38%
1 gen 2008 anni
383.0
+39.0
11.34%
1 gen 2009 anni
396.0
+13.0
3.39%
1 gen 2010 anni
398.0
+2.0
0.51%
1 gen 2011 anni
420.0
+22.0
5.53%
1 gen 2012 anni
440.0
+20.0
4.76%
1 gen 2013 anni
459.0
+19.0
4.32%
1 gen 2014 anni
483.0
+24.0
5.23%
1 gen 2015 anni
506.0
+23.0
4.76%
1 gen 2016 anni
521.0
+15.0
2.96%
Classificazione dei paesi secondo i statistiche attuali per anni


Commenti: