30
/it/
AIzaSyAYiBZKx7MnpbEhh9jyipgxe19OcubqV5w
April 1, 2024
281222
Venezuela, RB
VEN
true
2
1
Listed domestic companies, total
2015,2014,2013,2012,2011,2010,2009,2008,2007,2006,2005,2004,2003,2002,2001,2000,1999,1998,1997,1996,1995,1994,1993,1992,1991
Download
Biblioteca di statistiche globali →Venezuela, RB →

Listed domestic companies, total

Queste statistiche in altri paesi:

Arab WorldArgentinaArmeniaAustraliaAustriaAzerbaijanBahrainBangladeshBarbadosBelarusBelgiumBermudaBhutanBoliviaBosnia and HerzegovinaBotswanaBrazilBulgariaCanadaCayman IslandsCentral Europe and the BalticsChannel IslandsChileChinaColombiaCosta RicaCote d'IvoireCroatiaCyprusCzech RepublicDenmarkDominican RepublicEarly-demographic dividendEast Asia & PacificEast Asia & Pacific (excluding high income)East Asia & Pacific (IDA & IBRD countries)EcuadorEgypt, Arab Rep.El SalvadorEstoniaEuro areaEurope & Central AsiaEurope & Central Asia (excluding high income)Europe & Central Asia (IDA & IBRD countries)European UnionFijiFinlandFranceGeorgiaGermanyGhanaGreeceGuatemalaGuyanaHigh incomeHondurasHong Kong SAR, ChinaHungaryIBRD onlyIcelandIDA & IBRD totalIDA blendIDA totalIndiaIndonesiaIran, Islamic Rep.IrelandIsraelItalyJamaicaJapanJordanKazakhstanKenyaKorea, Dem. People’s Rep.Korea, Rep.KuwaitKyrgyz RepublicLate-demographic dividendLatin America & Caribbean Latin America & Caribbean (excluding high income)Latin America & the Caribbean (IDA & IBRD countries)LatviaLebanonLithuaniaLow & middle incomeLower middle incomeLuxembourgMacedonia, FYRMalawiMalaysiaMaltaMauritiusMexicoMiddle East & North AfricaMiddle East & North Africa (excluding high income)Middle East & North Africa (IDA & IBRD countries)Middle incomeMoldovaMongoliaMontenegroMoroccoNamibiaNepalNetherlandsNew ZealandNigeriaNorth AmericaNorwayOECD membersOmanOther small statesPakistanPanamaPapua New GuineaParaguayPeruPhilippinesPolandPortugalPost-demographic dividendQatarRomaniaRussian FederationSaudi ArabiaSerbiaSeychellesSingaporeSlovak RepublicSloveniaSouth AfricaSouth AsiaSouth Asia (IDA & IBRD)SpainSri LankaSt. Kitts and NevisSub-Saharan Africa Sub-Saharan Africa (excluding high income)Sub-Saharan Africa (IDA & IBRD countries)SwazilandSwedenSwitzerlandTanzaniaThailandTrinidad and TobagoTunisiaTurkeyUgandaUkraineUnited Arab EmiratesUnited KingdomUnited StatesUpper middle incomeUruguayUzbekistanVenezuela, RBVietnamWest Bank and GazaWorldZambiaZimbabwe

Linea del tempo:

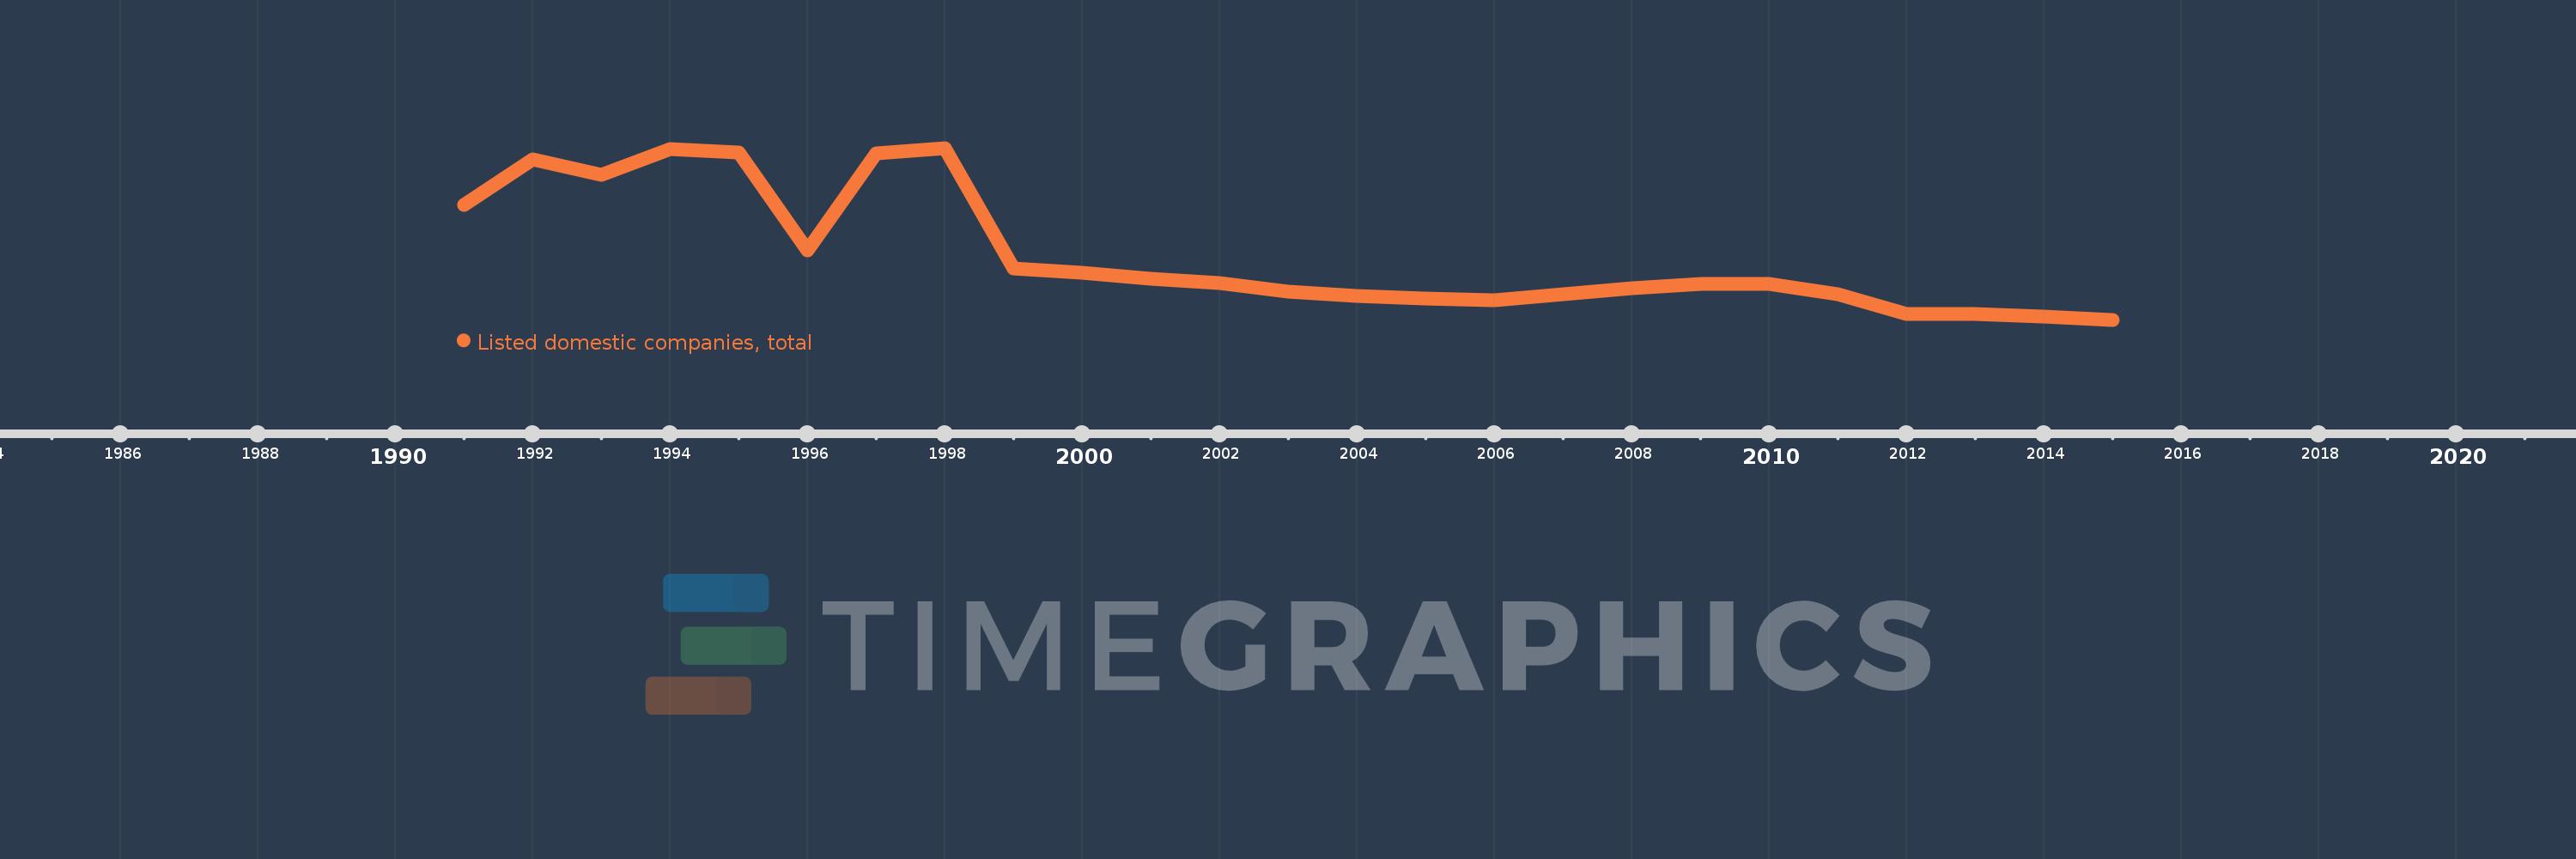
Questa scala temporale mostra un grafico dal 1991 anno al 2015 anno. Venezuela, RB. I dati fino ad 1990 anno non disponibili. Il numero di osservazioni attuali secondo i date: 25.

La fonte (nome):

Indicatori dello sviluppo mondiale

La fonte (organizzazione):

World Federation of Exchanges database.

Categorie:

Financial Sector

sono stati aggiornati

23 apr 2017 anni

Indicatori delle variazioni dei valori per anni

In media:
82.16
Minima:
37.0
1 gen 2015 anni
Massimo:
158.0
1 gen 1998 anni
Alla data di osservazione
Valore
Variazione assoluta
La variazione rispetto al valore precedente
1 gen 1991 anni
118.0
+118.0
0.0%
1 gen 1992 anni
150.0
+32.0
27.12%
1 gen 1993 anni
139.0
-11.0
-7.33%
1 gen 1994 anni
157.0
+18.0
12.95%
1 gen 1995 anni
155.0
-2.0
-1.27%
1 gen 1996 anni
86.0
-69.0
-44.52%
1 gen 1997 anni
154.0
+68.0
79.07%
1 gen 1998 anni
158.0
+4.0
2.6%
1 gen 1999 anni
73.0
-85.0
-53.8%
1 gen 2000 anni
70.0
-3.0
-4.11%
1 gen 2001 anni
66.0
-4.0
-5.71%
1 gen 2002 anni
63.0
-3.0
-4.55%
1 gen 2003 anni
57.0
-6.0
-9.52%
1 gen 2004 anni
54.0
-3.0
-5.26%
1 gen 2005 anni
52.0
-2.0
-3.7%
1 gen 2006 anni
51.0
-1.0
-1.92%
1 gen 2007 anni
55.0
+4.0
7.84%
1 gen 2008 anni
59.0
+4.0
7.27%
1 gen 2009 anni
62.0
+3.0
5.08%
1 gen 2010 anni
62.0
0.0
0.0%
1 gen 2011 anni
55.0
-7.0
-11.29%
1 gen 2012 anni
41.0
-14.0
-25.45%
1 gen 2013 anni
41.0
0.0
0.0%
1 gen 2014 anni
39.0
-2.0
-4.88%
1 gen 2015 anni
37.0
-2.0
-5.13%

Classificazione dei paesi secondo i statistiche attuali per anni