29
/es/
es
AIzaSyAYiBZKx7MnpbEhh9jyipgxe19OcubqV5w
April 1, 2024
245835
South Africa
ZAF
true
2
1
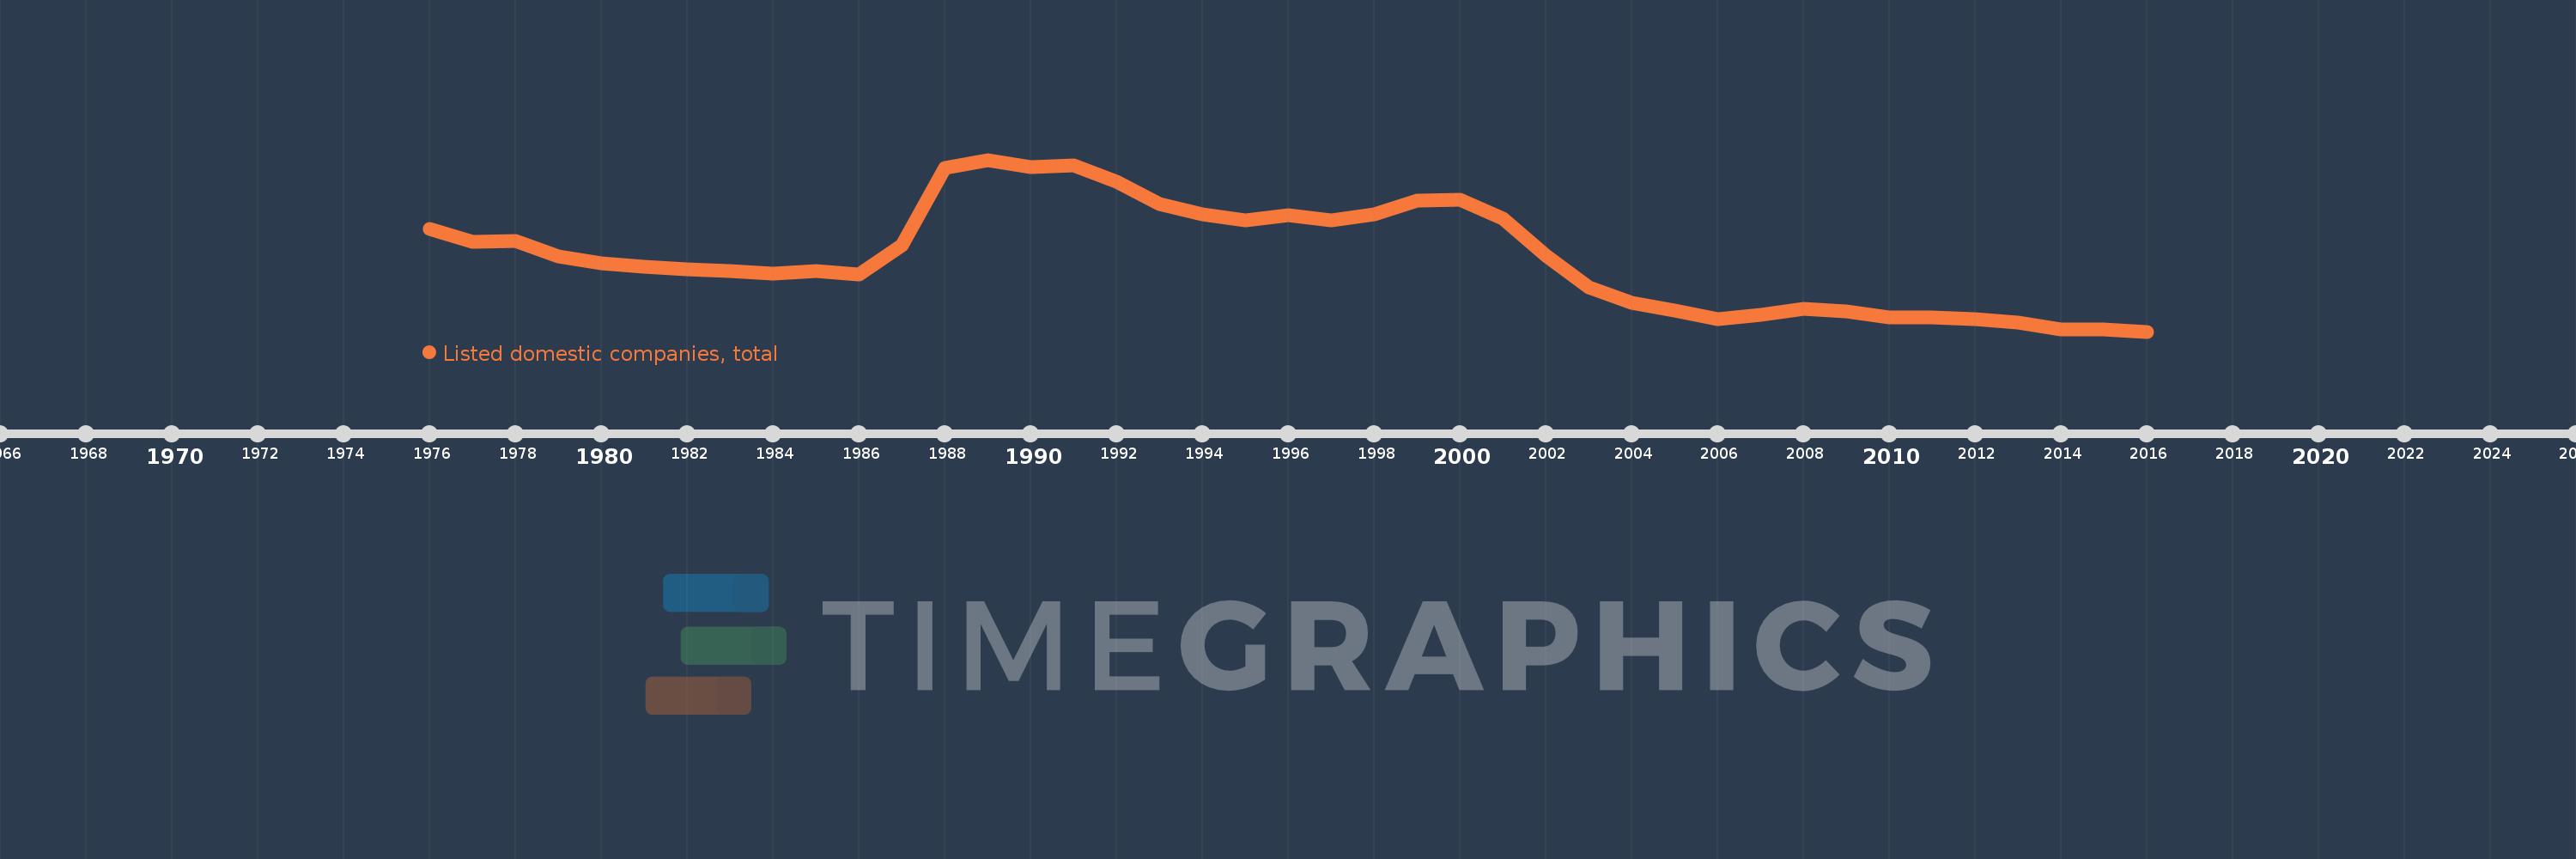
Listed domestic companies, total
2016,2015,2014,2013,2012,2011,2010,2009,2008,2007,2006,2005,2004,2003,2002,2001,2000,1999,1998,1997,1996,1995,1994,1993,1992,1991,1990,1989,1988,1987,1986,1985,1984,1983,1982,1981,1980,1979,1978,1977,1976
Estas estadísticas en otros países:
línea de tiempo (timeline):
En esta escala de tiempo se presenta un gráfico de 1976 y 2016 de South Africa. Los datos de 1975 están ausentes. El número de observaciones reales por fecha: 41.
Fuente (nombre):
Indicadores del desarrollo mundial
Fuente (organización):
World Federation of Exchanges database.
Categorías:
Financial Sector
Se ha actualizado:
23 abr 2017 año
Los indicadores de los cambios de valor en los últimos años
Mínimo:
316.0
1 ene 2016 año
Máximo:
754.0
1 ene 1989 año
A la fecha de observación
Valor
Cambio absoluto
El cambio con respecto al valor anterior
1 ene 1976 año
577.0
+577.0
0.0%
1 ene 1977 año
545.0
-32.0
-5.55%
1 ene 1978 año
547.0
+2.0
0.37%
1 ene 1979 año
507.0
-40.0
-7.31%
1 ene 1980 año
491.0
-16.0
-3.16%
1 ene 1981 año
481.0
-10.0
-2.04%
1 ene 1982 año
475.0
-6.0
-1.25%
1 ene 1983 año
470.0
-5.0
-1.05%
1 ene 1984 año
464.0
-6.0
-1.28%
1 ene 1985 año
470.0
+6.0
1.29%
1 ene 1986 año
462.0
-8.0
-1.7%
1 ene 1987 año
536.0
+74.0
16.02%
1 ene 1988 año
734.0
+198.0
36.94%
1 ene 1989 año
754.0
+20.0
2.72%
1 ene 1990 año
736.0
-18.0
-2.39%
1 ene 1991 año
740.0
+4.0
0.54%
1 ene 1992 año
698.0
-42.0
-5.68%
1 ene 1993 año
642.0
-56.0
-8.02%
1 ene 1994 año
615.0
-27.0
-4.21%
1 ene 1995 año
600.0
-15.0
-2.44%
1 ene 1996 año
612.0
+12.0
2.0%
1 ene 1997 año
599.0
-13.0
-2.12%
1 ene 1998 año
615.0
+16.0
2.67%
1 ene 1999 año
650.0
+35.0
5.69%
1 ene 2000 año
652.0
+2.0
0.31%
1 ene 2001 año
604.0
-48.0
-7.36%
1 ene 2002 año
510.0
-94.0
-15.56%
1 ene 2003 año
429.0
-81.0
-15.88%
1 ene 2004 año
390.0
-39.0
-9.09%
1 ene 2005 año
369.0
-21.0
-5.38%
1 ene 2006 año
348.0
-21.0
-5.69%
1 ene 2007 año
359.0
+11.0
3.16%
1 ene 2008 año
374.0
+15.0
4.18%
1 ene 2009 año
367.0
-7.0
-1.87%
1 ene 2010 año
353.0
-14.0
-3.81%
1 ene 2011 año
352.0
-1.0
-0.28%
1 ene 2012 año
347.0
-5.0
-1.42%
1 ene 2013 año
338.0
-9.0
-2.59%
1 ene 2014 año
322.0
-16.0
-4.73%
1 ene 2015 año
322.0
0.0
0.0%
1 ene 2016 año
316.0
-6.0
-1.86%
Ranking de los países por los datos estadísticos actuales


Comentarios: