29
/es/
es
AIzaSyAYiBZKx7MnpbEhh9jyipgxe19OcubqV5w
April 1, 2024
134321
France
FRA
true
2
1
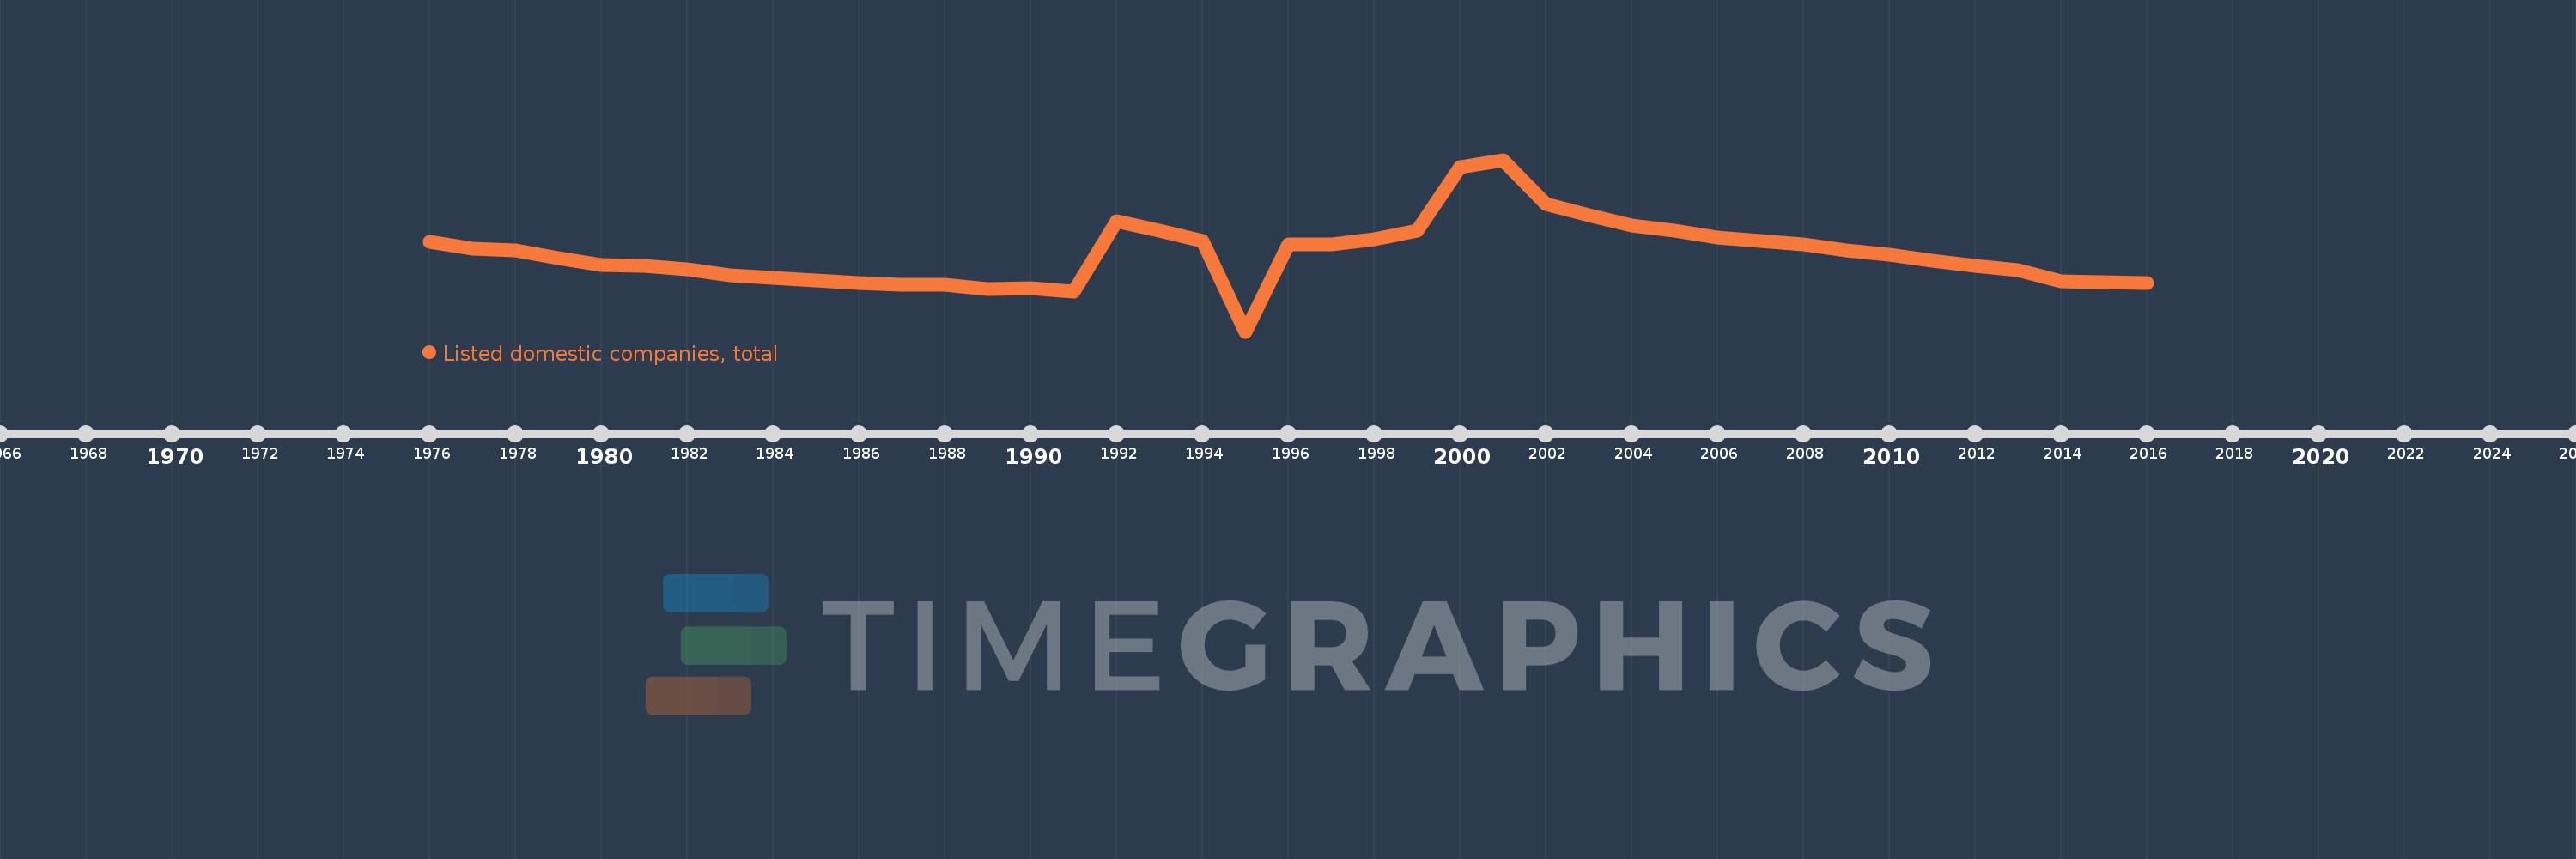
Listed domestic companies, total
2016,2015,2014,2013,2012,2011,2010,2009,2008,2007,2006,2005,2004,2003,2002,2001,2000,1999,1998,1997,1996,1995,1994,1993,1992,1991,1990,1989,1988,1987,1986,1985,1984,1983,1982,1981,1980,1979,1978,1977,1976
Estas estadísticas en otros países:
línea de tiempo (timeline):
En esta escala de tiempo se presenta un gráfico de 1976 y 2016 de France. Los datos de 1975 están ausentes. El número de observaciones reales por fecha: 41.
Fuente (nombre):
Indicadores del desarrollo mundial
Fuente (organización):
World Federation of Exchanges database.
Categorías:
Financial Sector
Se ha actualizado:
23 abr 2017 año
Los indicadores de los cambios de valor en los últimos años
Mínimo:
218.0
1 ene 1995 año
Máximo:
1.185 mil
1 ene 2001 año
A la fecha de observación
Valor
Cambio absoluto
El cambio con respecto al valor anterior
1 ene 1976 año
724.0
+724.0
0.0%
1 ene 1977 año
685.0
-39.0
-5.39%
1 ene 1978 año
674.0
-11.0
-1.61%
1 ene 1979 año
630.0
-44.0
-6.53%
1 ene 1980 año
595.0
-35.0
-5.56%
1 ene 1981 año
586.0
-9.0
-1.51%
1 ene 1982 año
568.0
-18.0
-3.07%
1 ene 1983 año
535.0
-33.0
-5.81%
1 ene 1984 año
518.0
-17.0
-3.18%
1 ene 1985 año
504.0
-14.0
-2.7%
1 ene 1986 año
489.0
-15.0
-2.98%
1 ene 1987 año
482.0
-7.0
-1.43%
1 ene 1988 año
481.0
-1.0
-0.21%
1 ene 1989 año
459.0
-22.0
-4.57%
1 ene 1990 año
462.0
+3.0
0.65%
1 ene 1991 año
443.0
-19.0
-4.11%
1 ene 1992 año
839.0
+396.0
89.39%
1 ene 1993 año
786.0
-53.0
-6.32%
1 ene 1994 año
726.0
-60.0
-7.63%
1 ene 1995 año
218.0
-508.0
-69.97%
1 ene 1996 año
710.0
+492.0
225.69%
1 ene 1997 año
708.0
-2.0
-0.28%
1 ene 1998 año
740.0
+32.0
4.52%
1 ene 1999 año
784.0
+44.0
5.95%
1 ene 2000 año
1.144 mil
+360.0
45.92%
1 ene 2001 año
1.185 mil
+41.0
3.58%
1 ene 2002 año
936.0
-249.0
-21.01%
1 ene 2003 año
874.0
-62.0
-6.62%
1 ene 2004 año
817.0
-57.0
-6.52%
1 ene 2005 año
787.0
-30.0
-3.67%
1 ene 2006 año
749.0
-38.0
-4.83%
1 ene 2007 año
730.0
-19.0
-2.54%
1 ene 2008 año
707.0
-23.0
-3.15%
1 ene 2009 año
673.0
-34.0
-4.81%
1 ene 2010 año
652.0
-21.0
-3.12%
1 ene 2011 año
617.0
-35.0
-5.37%
1 ene 2012 año
586.0
-31.0
-5.02%
1 ene 2013 año
562.0
-24.0
-4.1%
1 ene 2014 año
500.0
-62.0
-11.03%
1 ene 2015 año
495.0
-5.0
-1.0%
1 ene 2016 año
490.0
-5.0
-1.01%
Ranking de los países por los datos estadísticos actuales


Comentarios: