29
/es/
es
AIzaSyAYiBZKx7MnpbEhh9jyipgxe19OcubqV5w
April 1, 2024
57241
South Asia
SAS
false
2
1
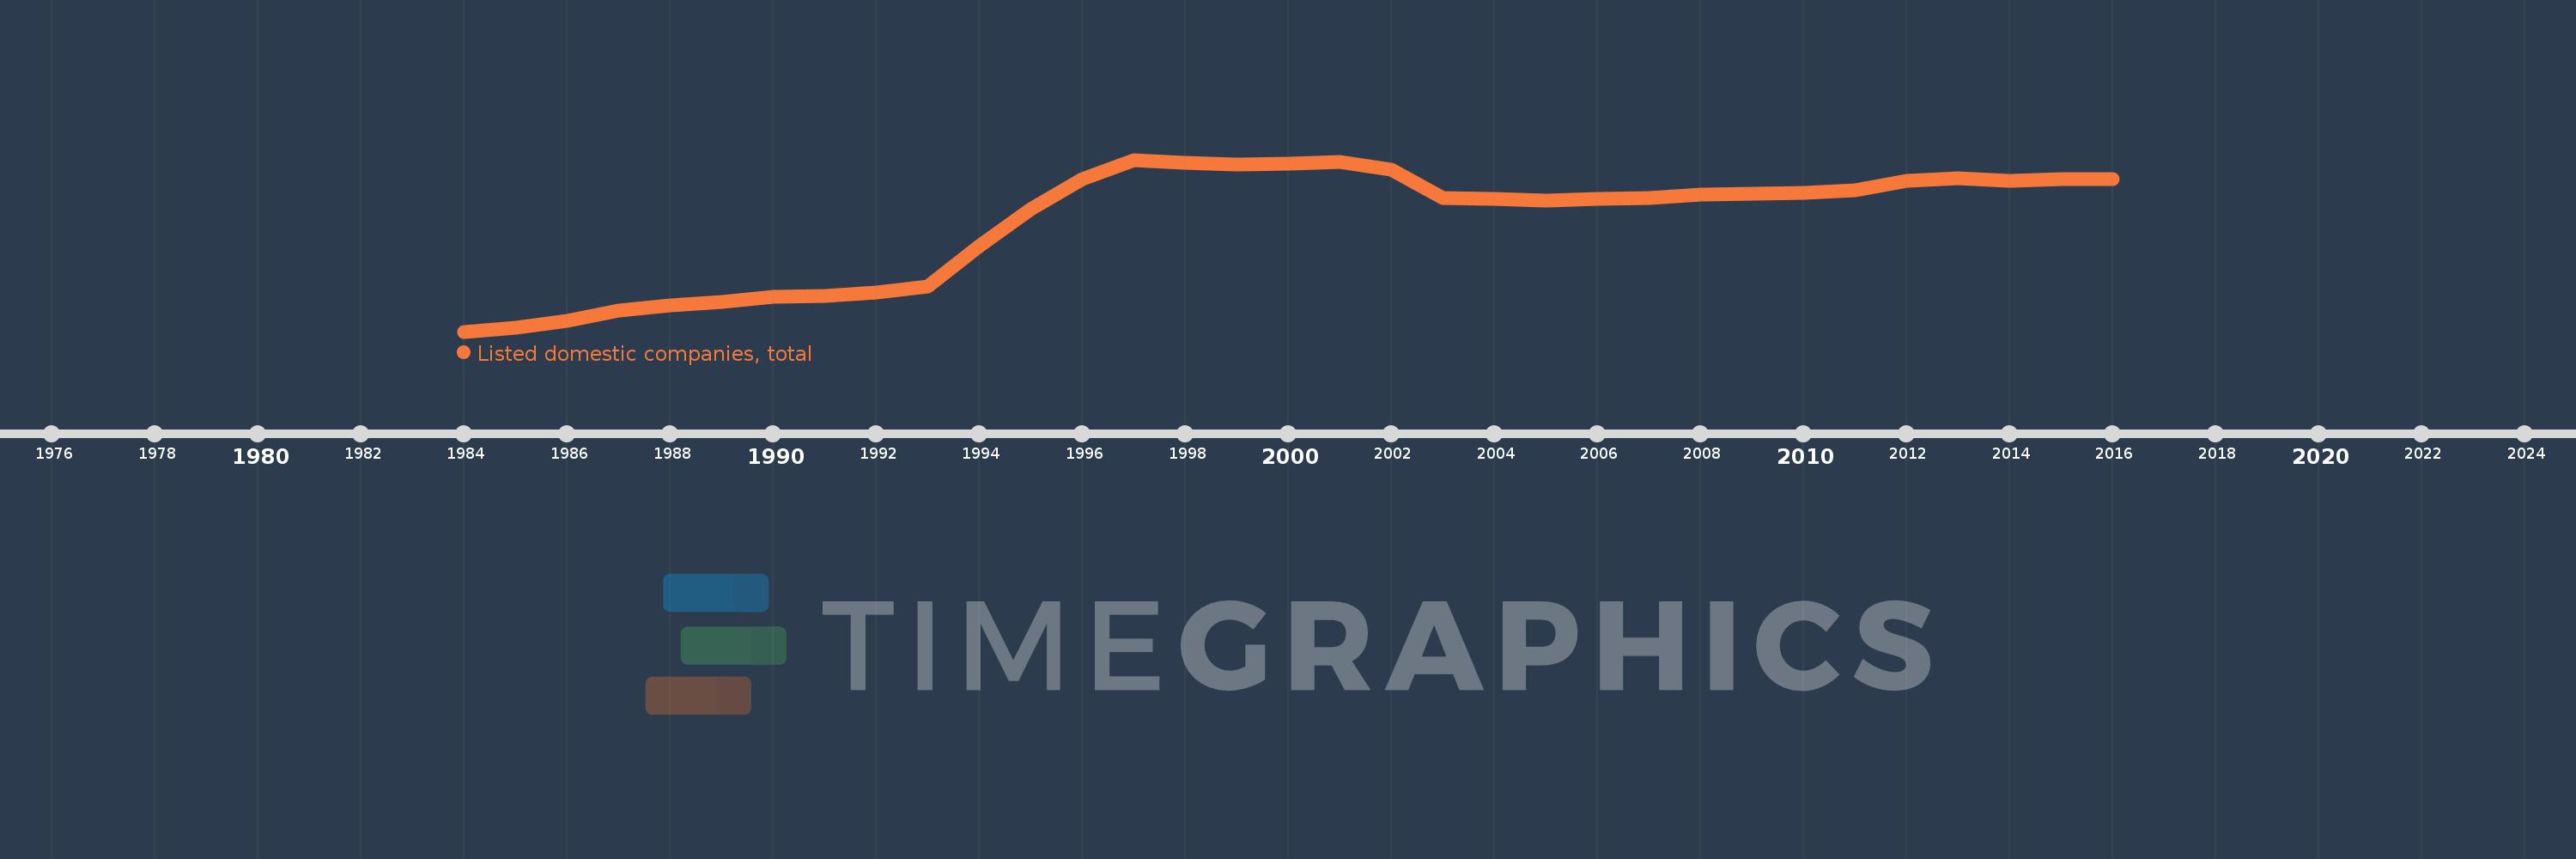
Listed domestic companies, total
2016,2015,2014,2013,2012,2011,2010,2009,2008,2007,2006,2005,2004,2003,2002,2001,2000,1999,1998,1997,1996,1995,1994,1993,1992,1991,1990,1989,1988,1987,1986,1985,1984
Estas estadísticas en otros países:
línea de tiempo (timeline):
En esta escala de tiempo se presenta un gráfico de 1984 y 2016 de South Asia. Los datos de 1983 están ausentes. El número de observaciones reales por fecha: 33.
Fuente (nombre):
Indicadores del desarrollo mundial
Fuente (organización):
World Federation of Exchanges database.
Categorías:
Financial Sector
Se ha actualizado:
23 abr 2017 año
Los indicadores de los cambios de valor en los últimos años
Mínimo:
1.151 mil
1 ene 1984 año
Máximo:
7.379 mil
1 ene 1997 año
A la fecha de observación
Valor
Cambio absoluto
El cambio con respecto al valor anterior
1 ene 1984 año
1.151 mil
+1.151 mil
0.0%
1 ene 1985 año
1.295 mil
+144.0
12.51%
1 ene 1986 año
1.529 mil
+234.0
18.07%
1 ene 1987 año
1.911 mil
+382.0
24.98%
1 ene 1988 año
2.095 mil
+184.0
9.63%
1 ene 1989 año
2.24 mil
+145.0
6.92%
1 ene 1990 año
2.407 mil
+167.0
7.46%
1 ene 1991 año
2.435 mil
+28.0
1.16%
1 ene 1992 año
2.556 mil
+121.0
4.97%
1 ene 1993 año
2.781 mil
+225.0
8.8%
1 ene 1994 año
4.256 mil
+1.475 mil
53.04%
1 ene 1995 año
5.577 mil
+1.321 mil
31.04%
1 ene 1996 año
6.665 mil
+1.088 mil
19.51%
1 ene 1997 año
7.379 mil
+714.0
10.71%
1 ene 1998 año
7.275 mil
-104.0
-1.41%
1 ene 1999 año
7.209 mil
-66.0
-0.91%
1 ene 2000 año
7.247 mil
+38.0
0.53%
1 ene 2001 año
7.289 mil
+42.0
0.58%
1 ene 2002 año
7.023 mil
-266.0
-3.65%
1 ene 2003 año
5.986 mil
-1.037 mil
-14.77%
1 ene 2004 año
5.961 mil
-25.0
-0.42%
1 ene 2005 año
5.906 mil
-55.0
-0.92%
1 ene 2006 año
5.961 mil
+55.0
0.93%
1 ene 2007 año
5.995 mil
+34.0
0.57%
1 ene 2008 año
6.107 mil
+112.0
1.87%
1 ene 2009 año
6.155 mil
+48.0
0.79%
1 ene 2010 año
6.177 mil
+22.0
0.36%
1 ene 2011 año
6.282 mil
+105.0
1.7%
1 ene 2012 año
6.619 mil
+337.0
5.36%
1 ene 2013 año
6.702 mil
+83.0
1.25%
1 ene 2014 año
6.614 mil
-88.0
-1.31%
1 ene 2015 año
6.666 mil
+52.0
0.79%
1 ene 2016 año
6.672 mil
+6.0
0.09%
Ranking de los países por los datos estadísticos actuales


Comentarios: