29
/it/
it
AIzaSyAYiBZKx7MnpbEhh9jyipgxe19OcubqV5w
April 1, 2024
204828
Myanmar
MMR
true
2
1
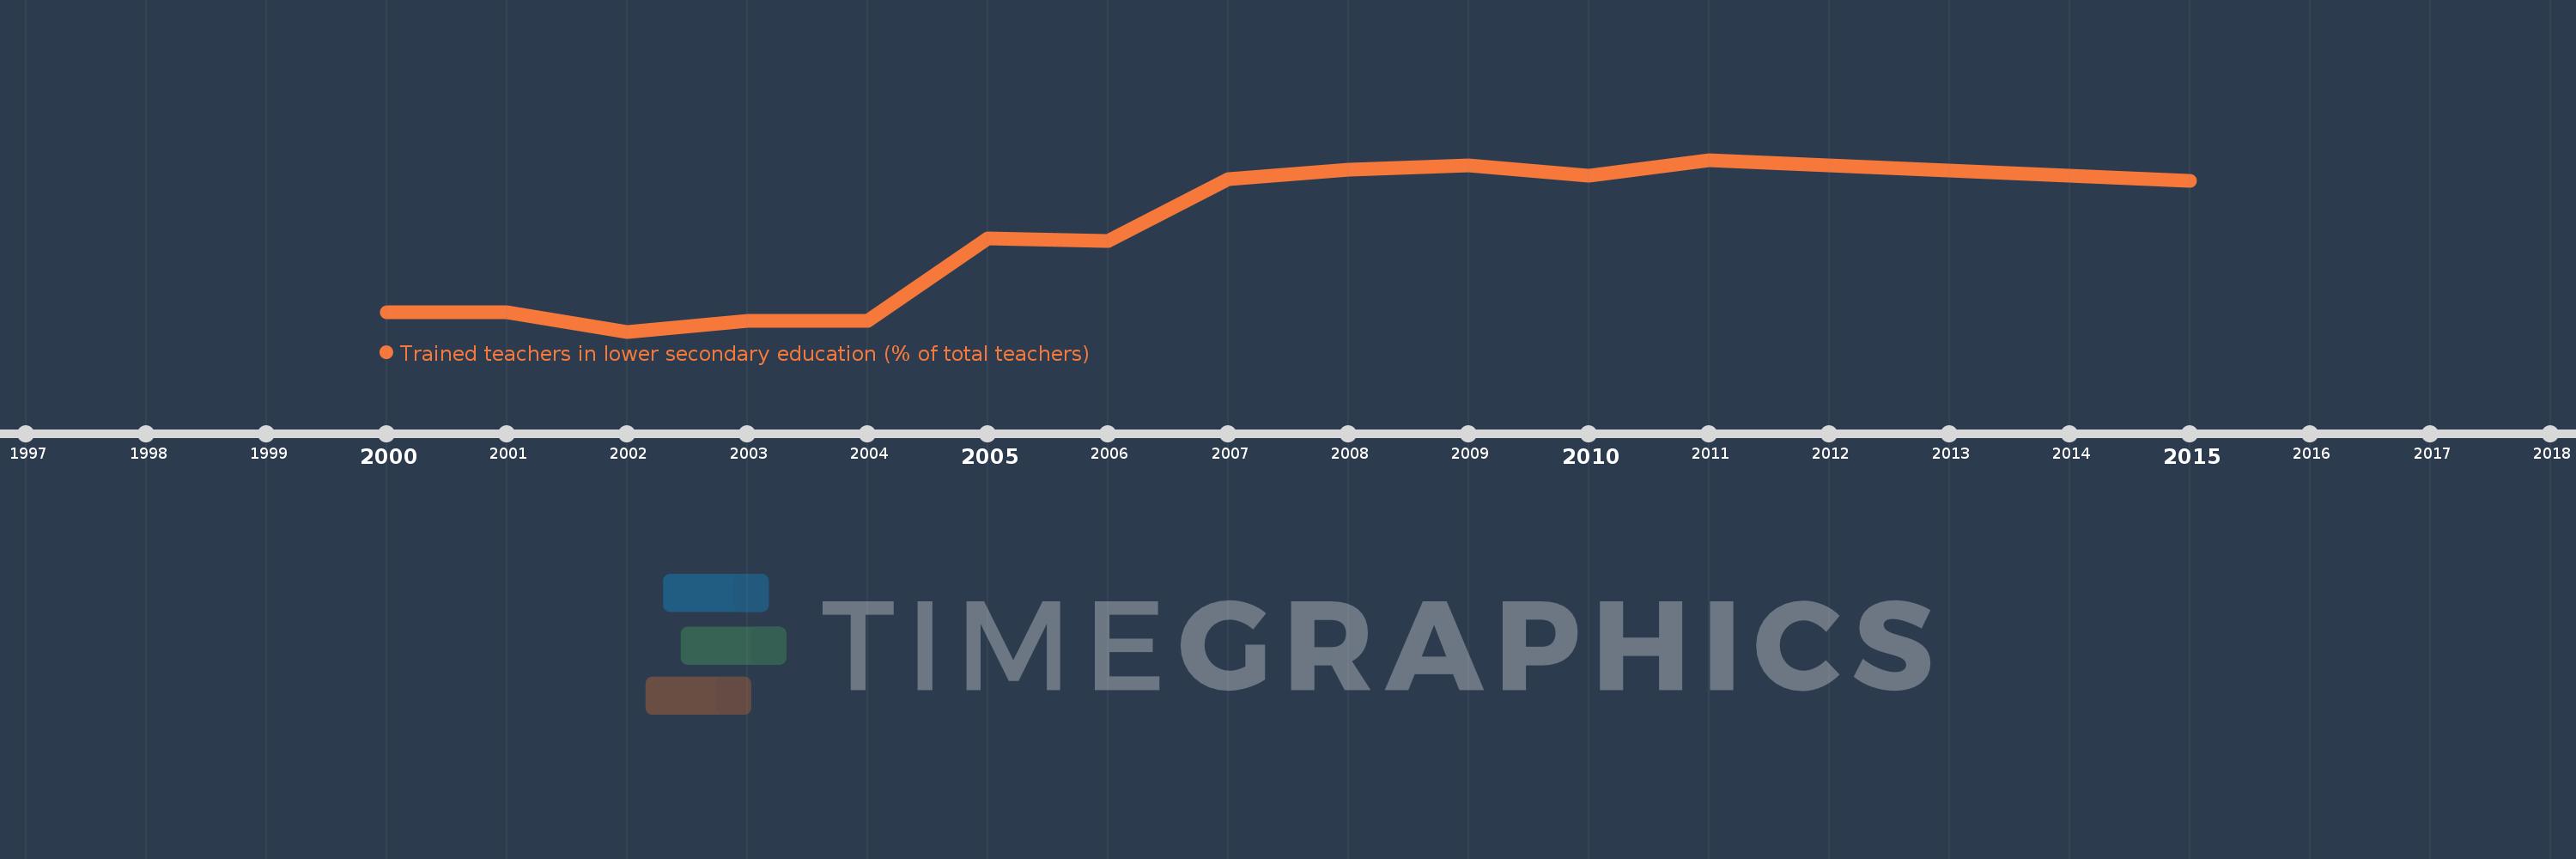
Trained teachers in lower secondary education (% of total teachers)
2015,2011,2010,2009,2008,2007,2006,2005,2004,2003,2002,2001,2000
Queste statistiche in altri paesi:
Linea del tempo:
Questa scala temporale mostra un grafico dal 2000 anno al 2015 anno. Myanmar. I dati fino ad 1999 anno non disponibili. Il numero di osservazioni attuali secondo i date: 13.
La fonte (nome):
Indicatori dello sviluppo mondiale
La fonte (organizzazione):
United Nations Educational, Scientific, and Cultural Organization (UNESCO) Institute for Statistics.
Categorie:
Education
sono stati aggiornati
23 apr 2017 anni
Indicatori delle variazioni dei valori per anni
Minima:
57.5
1 gen 2002 anni
Massimo:
98.349
1 gen 2011 anni
Alla data di osservazione
Valore
Variazione assoluta
La variazione rispetto al valore precedente
1 gen 2000 anni
62.098
+62.098
0.0%
1 gen 2001 anni
62.099
+0.001
0.0%
1 gen 2002 anni
57.5
-4.599
-7.41%
1 gen 2003 anni
59.999
+2.499
4.35%
1 gen 2004 anni
59.999
+0.001
0.0%
1 gen 2005 anni
79.7
+19.701
32.84%
1 gen 2006 anni
79.001
-0.7
-0.88%
1 gen 2007 anni
93.81
+14.809
18.75%
1 gen 2008 anni
96.001
+2.191
2.34%
1 gen 2009 anni
97.0
+1.0
1.04%
1 gen 2010 anni
94.519
-2.481
-2.56%
1 gen 2011 anni
98.349
+3.83
4.05%
1 gen 2015 anni
93.249
-5.1
-5.19%
Classificazione dei paesi secondo i statistiche attuali per anni


Commenti: