29
/it/
it
AIzaSyAYiBZKx7MnpbEhh9jyipgxe19OcubqV5w
April 1, 2024
40407
IDA total
IDA
false
2
1
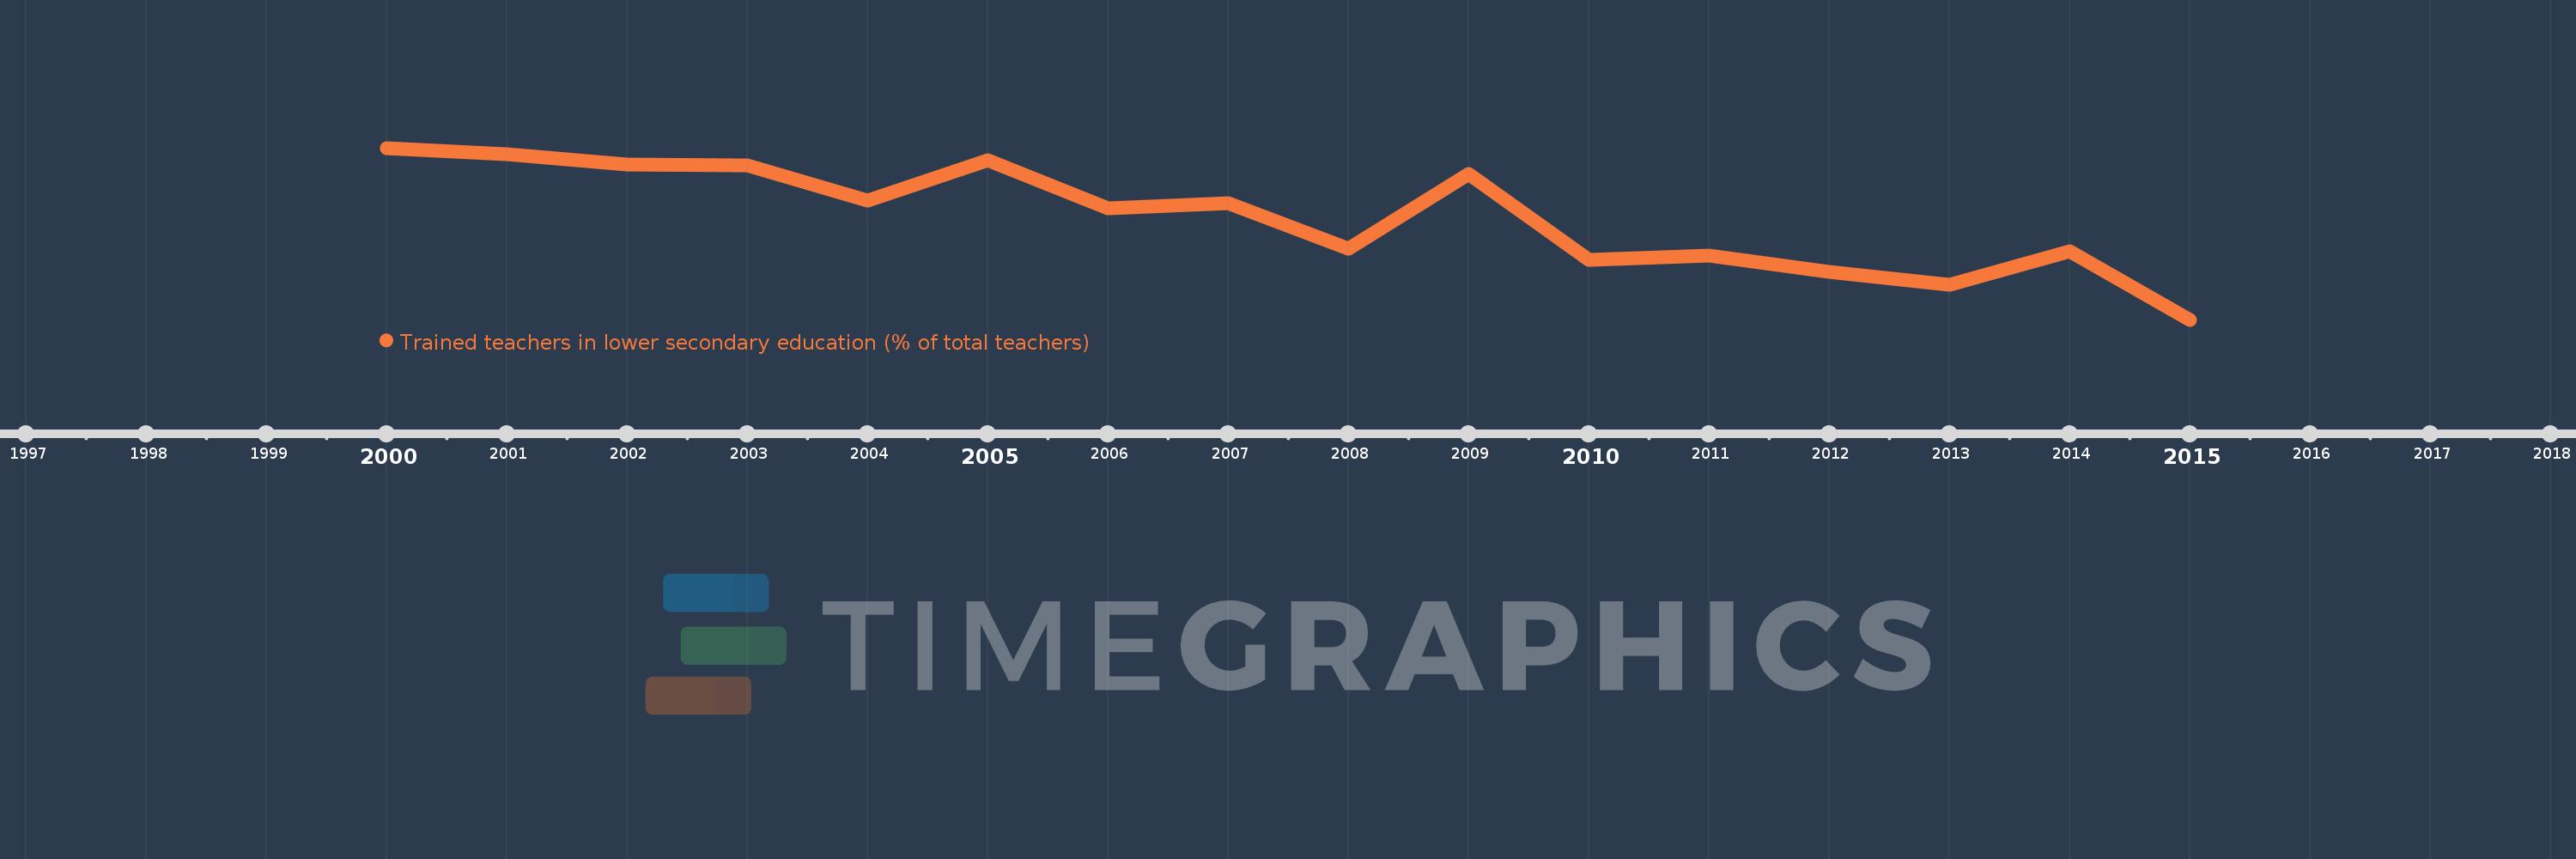
Trained teachers in lower secondary education (% of total teachers)
2015,2014,2013,2012,2011,2010,2009,2008,2007,2006,2005,2004,2003,2002,2001,2000
Queste statistiche in altri paesi:
Linea del tempo:
Questa scala temporale mostra un grafico dal 2000 anno al 2015 anno. IDA total. I dati fino ad 1999 anno non disponibili. Il numero di osservazioni attuali secondo i date: 16.
La fonte (nome):
Indicatori dello sviluppo mondiale
La fonte (organizzazione):
United Nations Educational, Scientific, and Cultural Organization (UNESCO) Institute for Statistics.
Categorie:
Education
sono stati aggiornati
23 apr 2017 anni
Indicatori delle variazioni dei valori per anni
Minima:
71.14
1 gen 2015 anni
Massimo:
80.236
1 gen 2000 anni
Alla data di osservazione
Valore
Variazione assoluta
La variazione rispetto al valore precedente
1 gen 2000 anni
80.236
+80.236
0.0%
1 gen 2001 anni
79.915
-0.32
-0.4%
1 gen 2002 anni
79.341
-0.574
-0.72%
1 gen 2003 anni
79.3
-0.04
-0.05%
1 gen 2004 anni
77.433
-1.868
-2.36%
1 gen 2005 anni
79.573
+2.14
2.76%
1 gen 2006 anni
77.017
-2.556
-3.21%
1 gen 2007 anni
77.295
+0.279
0.36%
1 gen 2008 anni
74.917
-2.379
-3.08%
1 gen 2009 anni
78.873
+3.957
5.28%
1 gen 2010 anni
74.322
-4.552
-5.77%
1 gen 2011 anni
74.549
+0.227
0.31%
1 gen 2012 anni
73.692
-0.857
-1.15%
1 gen 2013 anni
73.007
-0.685
-0.93%
1 gen 2014 anni
74.743
+1.736
2.38%
1 gen 2015 anni
71.14
-3.603
-4.82%
Classificazione dei paesi secondo i statistiche attuali per anni


Commenti: