29
/it/
it
AIzaSyAYiBZKx7MnpbEhh9jyipgxe19OcubqV5w
April 1, 2024
189726
Maldives
MDV
true
2
1
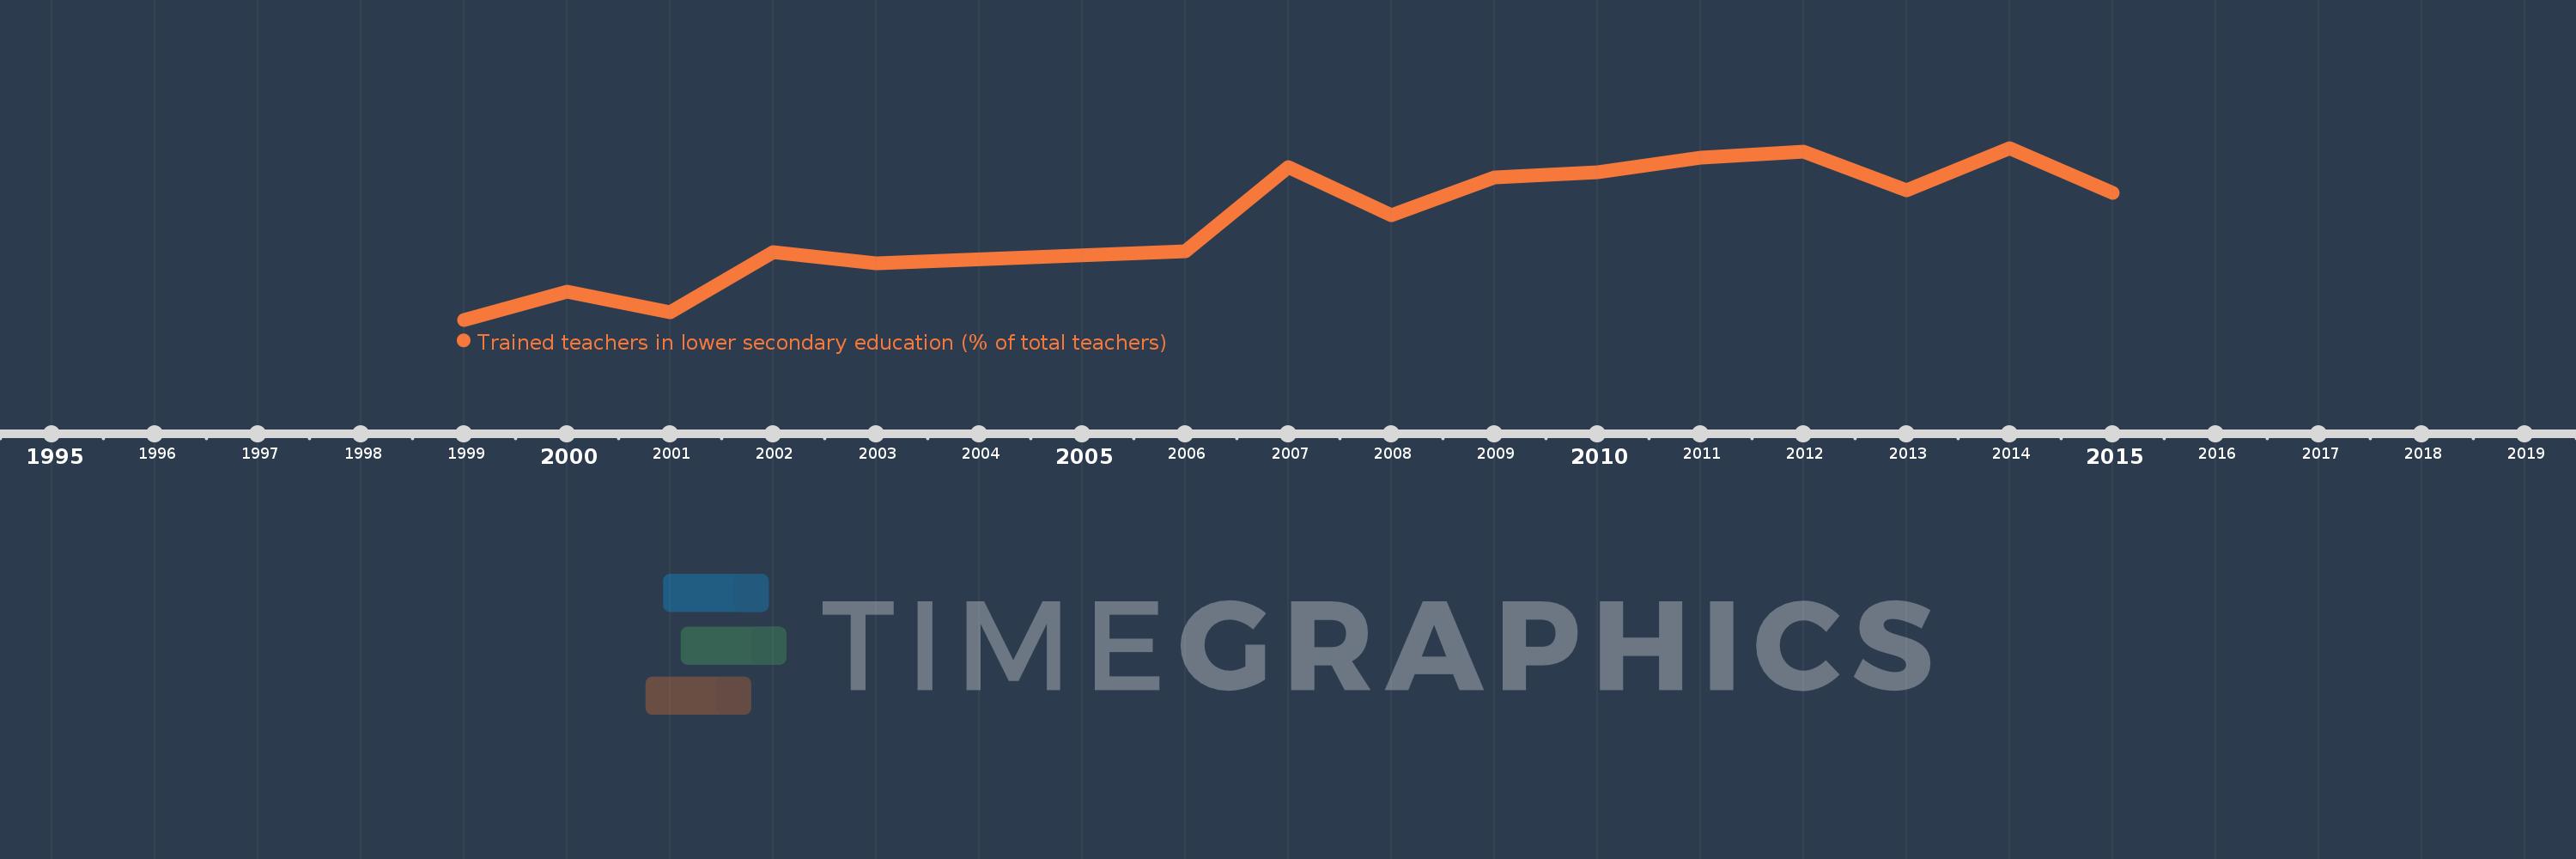
Trained teachers in lower secondary education (% of total teachers)
2015,2014,2013,2012,2011,2010,2009,2008,2007,2006,2003,2002,2001,2000,1999
Queste statistiche in altri paesi:
Linea del tempo:
Questa scala temporale mostra un grafico dal 1999 anno al 2015 anno. Maldives. I dati fino ad 1998 anno non disponibili. Il numero di osservazioni attuali secondo i date: 15.
La fonte (nome):
Indicatori dello sviluppo mondiale
La fonte (organizzazione):
United Nations Educational, Scientific, and Cultural Organization (UNESCO) Institute for Statistics.
Categorie:
Education
sono stati aggiornati
23 apr 2017 anni
Indicatori delle variazioni dei valori per anni
Minima:
75.33
1 gen 1999 anni
Massimo:
98.929
1 gen 2014 anni
Alla data di osservazione
Valore
Variazione assoluta
La variazione rispetto al valore precedente
1 gen 1999 anni
75.33
+75.33
0.0%
1 gen 2000 anni
79.197
+3.867
5.13%
1 gen 2001 anni
76.303
-2.895
-3.65%
1 gen 2002 anni
84.564
+8.262
10.83%
1 gen 2003 anni
83.052
-1.512
-1.79%
1 gen 2006 anni
84.712
+1.66
2.0%
1 gen 2007 anni
96.257
+11.545
13.63%
1 gen 2008 anni
89.724
-6.534
-6.79%
1 gen 2009 anni
94.94
+5.216
5.81%
1 gen 2010 anni
95.568
+0.628
0.66%
1 gen 2011 anni
97.634
+2.065
2.16%
1 gen 2012 anni
98.378
+0.744
0.76%
1 gen 2013 anni
93.097
-5.281
-5.37%
1 gen 2014 anni
98.929
+5.832
6.26%
1 gen 2015 anni
92.806
-6.123
-6.19%
Classificazione dei paesi secondo i statistiche attuali per anni


Commenti: