29
/fr/
fr
AIzaSyAYiBZKx7MnpbEhh9jyipgxe19OcubqV5w
April 1, 2024
98645
Cambodia
KHM
true
2
1
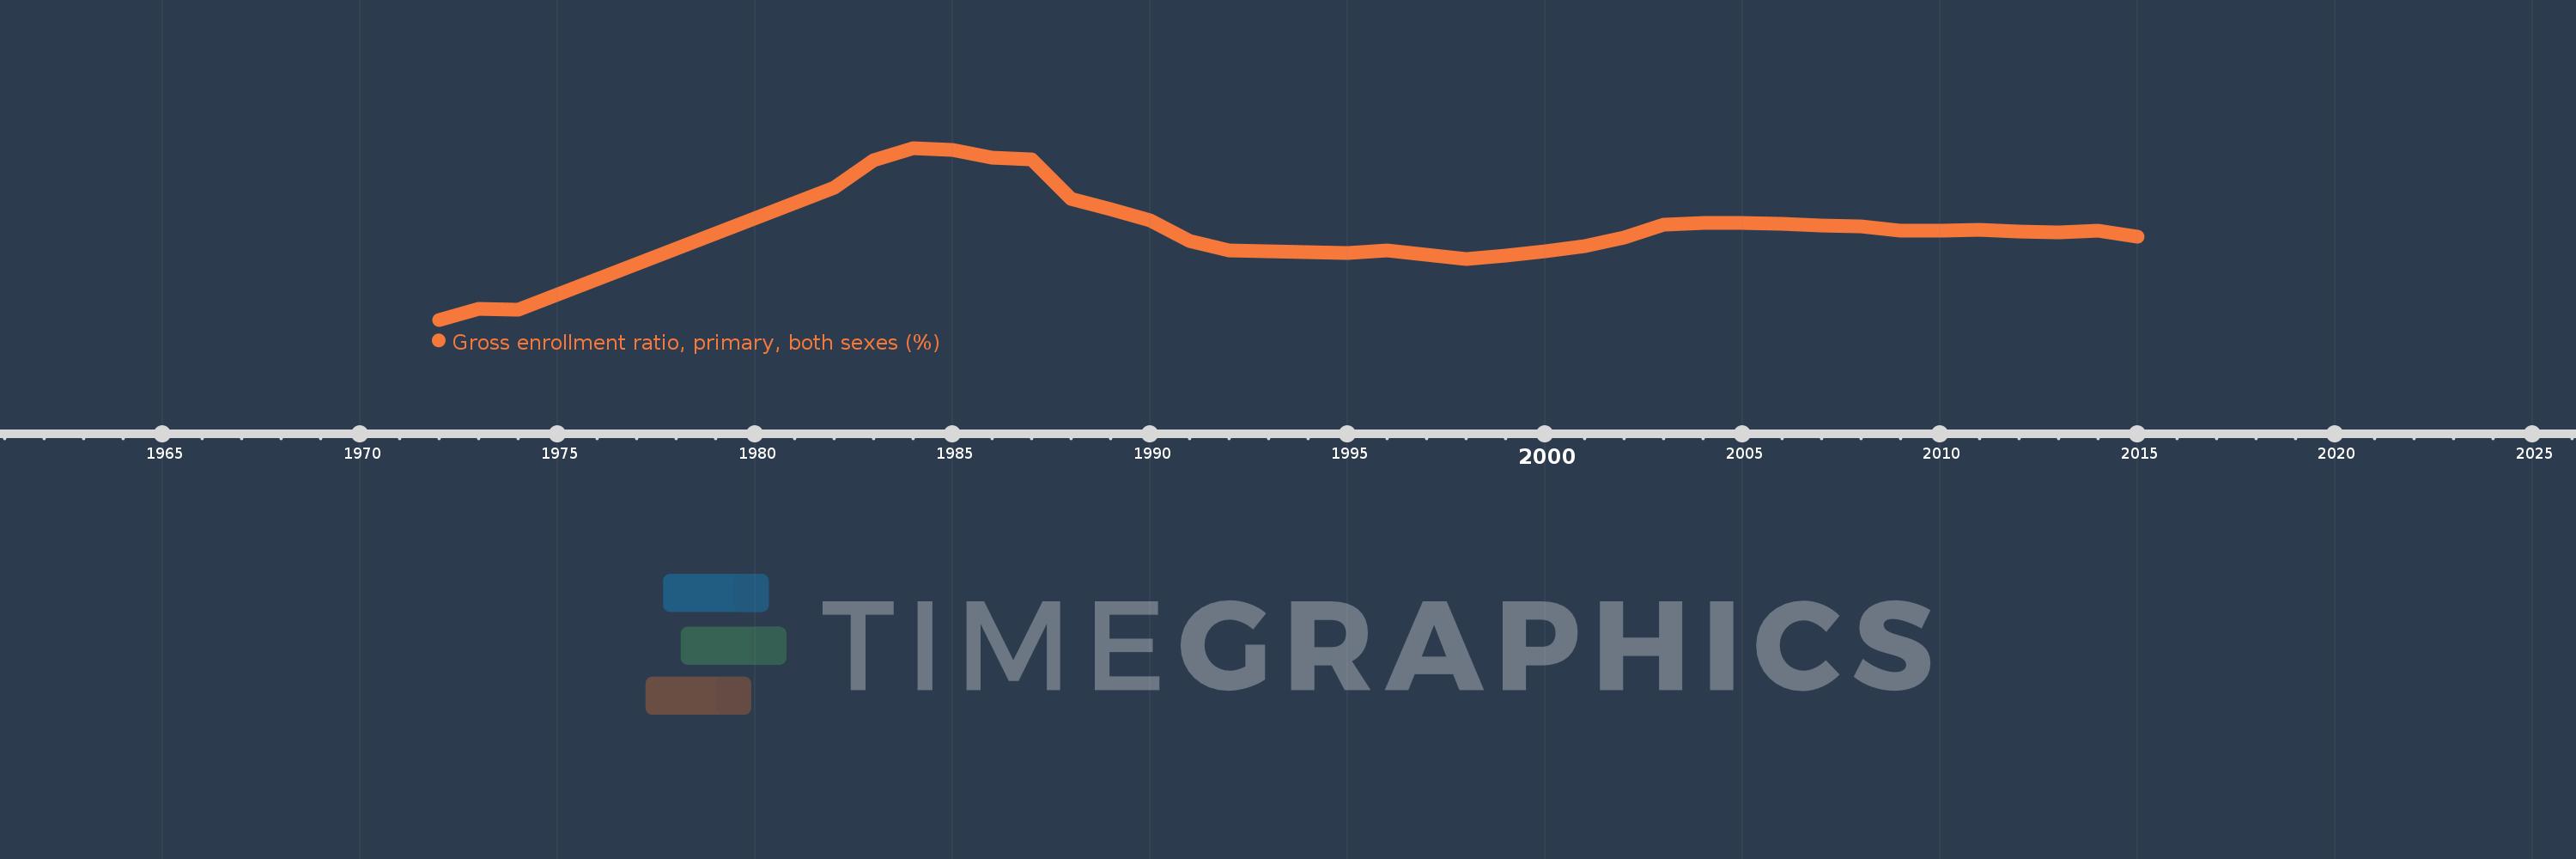
Gross enrollment ratio, primary, both sexes (%)
2015,2014,2013,2012,2011,2010,2009,2008,2007,2006,2005,2004,2003,2002,2001,2000,1999,1998,1996,1995,1992,1991,1990,1989,1988,1987,1986,1985,1984,1983,1982,1974,1973,1972
Cette statistique dans les autres pays:
AfghanistanAlbaniaAlgeriaAndorraAngolaAntigua and BarbudaArab WorldArgentinaArmeniaArubaAustraliaAustriaAzerbaijanBahamas, TheBahrainBangladeshBarbadosBelarusBelgiumBelizeBeninBermudaBhutanBoliviaBosnia and HerzegovinaBotswanaBrazilBritish Virgin IslandsBrunei DarussalamBulgariaBurkina FasoBurundiCabo VerdeCambodiaCameroonCanadaCaribbean small statesCentral African RepublicCentral Europe and the BalticsChadChileChinaColombiaComorosCongo, Dem. Rep.Congo, Rep.Costa RicaCote d'IvoireCroatiaCubaCuracaoCyprusCzech RepublicDenmarkDjiboutiDominicaDominican RepublicEarly-demographic dividendEast Asia & PacificEast Asia & Pacific (excluding high income)East Asia & Pacific (IDA & IBRD countries)EcuadorEgypt, Arab Rep.El SalvadorEquatorial GuineaEritreaEstoniaEthiopiaEuro areaEurope & Central AsiaEurope & Central Asia (excluding high income)Europe & Central Asia (IDA & IBRD countries)European UnionFijiFinlandFragile and conflict affected situationsFranceGabonGambia, TheGeorgiaGermanyGhanaGreeceGrenadaGuatemalaGuineaGuinea-BissauGuyanaHaitiHeavily indebted poor countries (HIPC)High incomeHondurasHong Kong SAR, ChinaHungaryIBRD onlyIcelandIDA & IBRD totalIDA blendIDA onlyIDA totalIndiaIndonesiaIran, Islamic Rep.IraqIrelandIsraelItalyJamaicaJapanJordanKazakhstanKenyaKiribatiKorea, Dem. People’s Rep.Korea, Rep.KuwaitKyrgyz RepublicLao PDRLate-demographic dividendLatin America & Caribbean Latin America & Caribbean (excluding high income)Latin America & the Caribbean (IDA & IBRD countries)LatviaLeast developed countries: UN classificationLebanonLesothoLiberiaLibyaLiechtensteinLithuaniaLow & middle incomeLow incomeLower middle incomeLuxembourgMacao SAR, ChinaMacedonia, FYRMadagascarMalawiMalaysiaMaldivesMaliMaltaMarshall IslandsMauritaniaMauritiusMexicoMicronesia, Fed. Sts.Middle East & North AfricaMiddle East & North Africa (excluding high income)Middle East & North Africa (IDA & IBRD countries)Middle incomeMoldovaMongoliaMontenegroMoroccoMozambiqueMyanmarNamibiaNauruNepalNetherlandsNew ZealandNicaraguaNigerNigeriaNorth AmericaNorwayOECD membersOmanOther small statesPacific island small statesPakistanPalauPanamaPapua New GuineaParaguayPeruPhilippinesPolandPortugalPost-demographic dividendPre-demographic dividendPuerto RicoQatarRomaniaRussian FederationRwandaSamoaSan MarinoSao Tome and PrincipeSaudi ArabiaSenegalSerbiaSeychellesSierra LeoneSlovak RepublicSloveniaSmall statesSolomon IslandsSomaliaSouth AfricaSouth AsiaSouth Asia (IDA & IBRD)South SudanSpainSri LankaSt. Kitts and NevisSt. LuciaSt. Vincent and the GrenadinesSub-Saharan Africa Sub-Saharan Africa (excluding high income)Sub-Saharan Africa (IDA & IBRD countries)SudanSurinameSwazilandSwedenSwitzerlandSyrian Arab RepublicTajikistanTanzaniaThailandTimor-LesteTogoTongaTrinidad and TobagoTunisiaTurkeyTurkmenistanTuvaluUgandaUkraineUnited Arab EmiratesUnited KingdomUnited StatesUpper middle incomeUruguayUzbekistanVanuatuVenezuela, RBVietnamWest Bank and GazaWorldYemen, Rep.ZambiaZimbabwe La ligne de temps
Cette échelle de temps montre un graphique de 1972 année à 2015 année Cambodia. Les données jusqu'à 1971 année ne sont pas présentés. Quantité d'observations actuelles selon dates: 34.
Source (désignation):
Les indicateurs du développement mondiale
Source (organisation):
UNESCO Institute for Statistics
Catégories:
Education
Dernière mise à jour
23 avr. 2017
Les indicateurs de changement de valeurs selon les années
Minimum:
27.615
1 janv. 1972
Maximum:
211.297
1 janv. 1984
Pour la date d''observation
Valeur
Changement absolu
Le changement par rapport à la valeur précédente
1 janv. 1972
27.615
+27.615
0.0%
1 janv. 1973
38.931
+11.316
40.98%
1 janv. 1974
37.965
-0.966
-2.48%
1 janv. 1982
169.13
+131.165
345.49%
1 janv. 1983
197.8
+28.671
16.95%
1 janv. 1984
211.297
+13.497
6.82%
1 janv. 1985
209.363
-1.934
-0.92%
1 janv. 1986
201.11
-8.253
-3.94%
1 janv. 1987
199.488
-1.622
-0.81%
1 janv. 1988
156.502
-42.986
-21.55%
1 janv. 1989
146.216
-10.287
-6.57%
1 janv. 1990
133.622
-12.594
-8.61%
1 janv. 1991
111.919
-21.703
-16.24%
1 janv. 1992
101.381
-10.538
-9.42%
1 janv. 1995
98.708
-2.673
-2.64%
1 janv. 1996
101.274
+2.565
2.6%
1 janv. 1998
92.872
-8.402
-8.3%
1 janv. 1999
96.081
+3.209
3.46%
1 janv. 2000
100.918
+4.837
5.03%
1 janv. 2001
106.47
+5.552
5.5%
1 janv. 2002
115.438
+8.968
8.42%
1 janv. 2003
128.984
+13.547
11.73%
1 janv. 2004
131.016
+2.032
1.58%
1 janv. 2005
131.472
+0.456
0.35%
1 janv. 2006
130.438
-1.034
-0.79%
1 janv. 2007
128.378
-2.061
-1.58%
1 janv. 2008
127.39
-0.987
-0.77%
1 janv. 2009
123.31
-4.08
-3.2%
1 janv. 2010
122.836
-0.474
-0.38%
1 janv. 2011
123.39
+0.554
0.45%
1 janv. 2012
121.705
-1.685
-1.37%
1 janv. 2013
121.354
-0.35
-0.29%
1 janv. 2014
123.008
+1.654
1.36%
1 janv. 2015
116.39
-6.619
-5.38%
Classement des pays selon les statistiques actuelles par années


Commentaires: