29
/fr/
fr
AIzaSyAYiBZKx7MnpbEhh9jyipgxe19OcubqV5w
April 1, 2024
144424
Guatemala
GTM
true
2
1
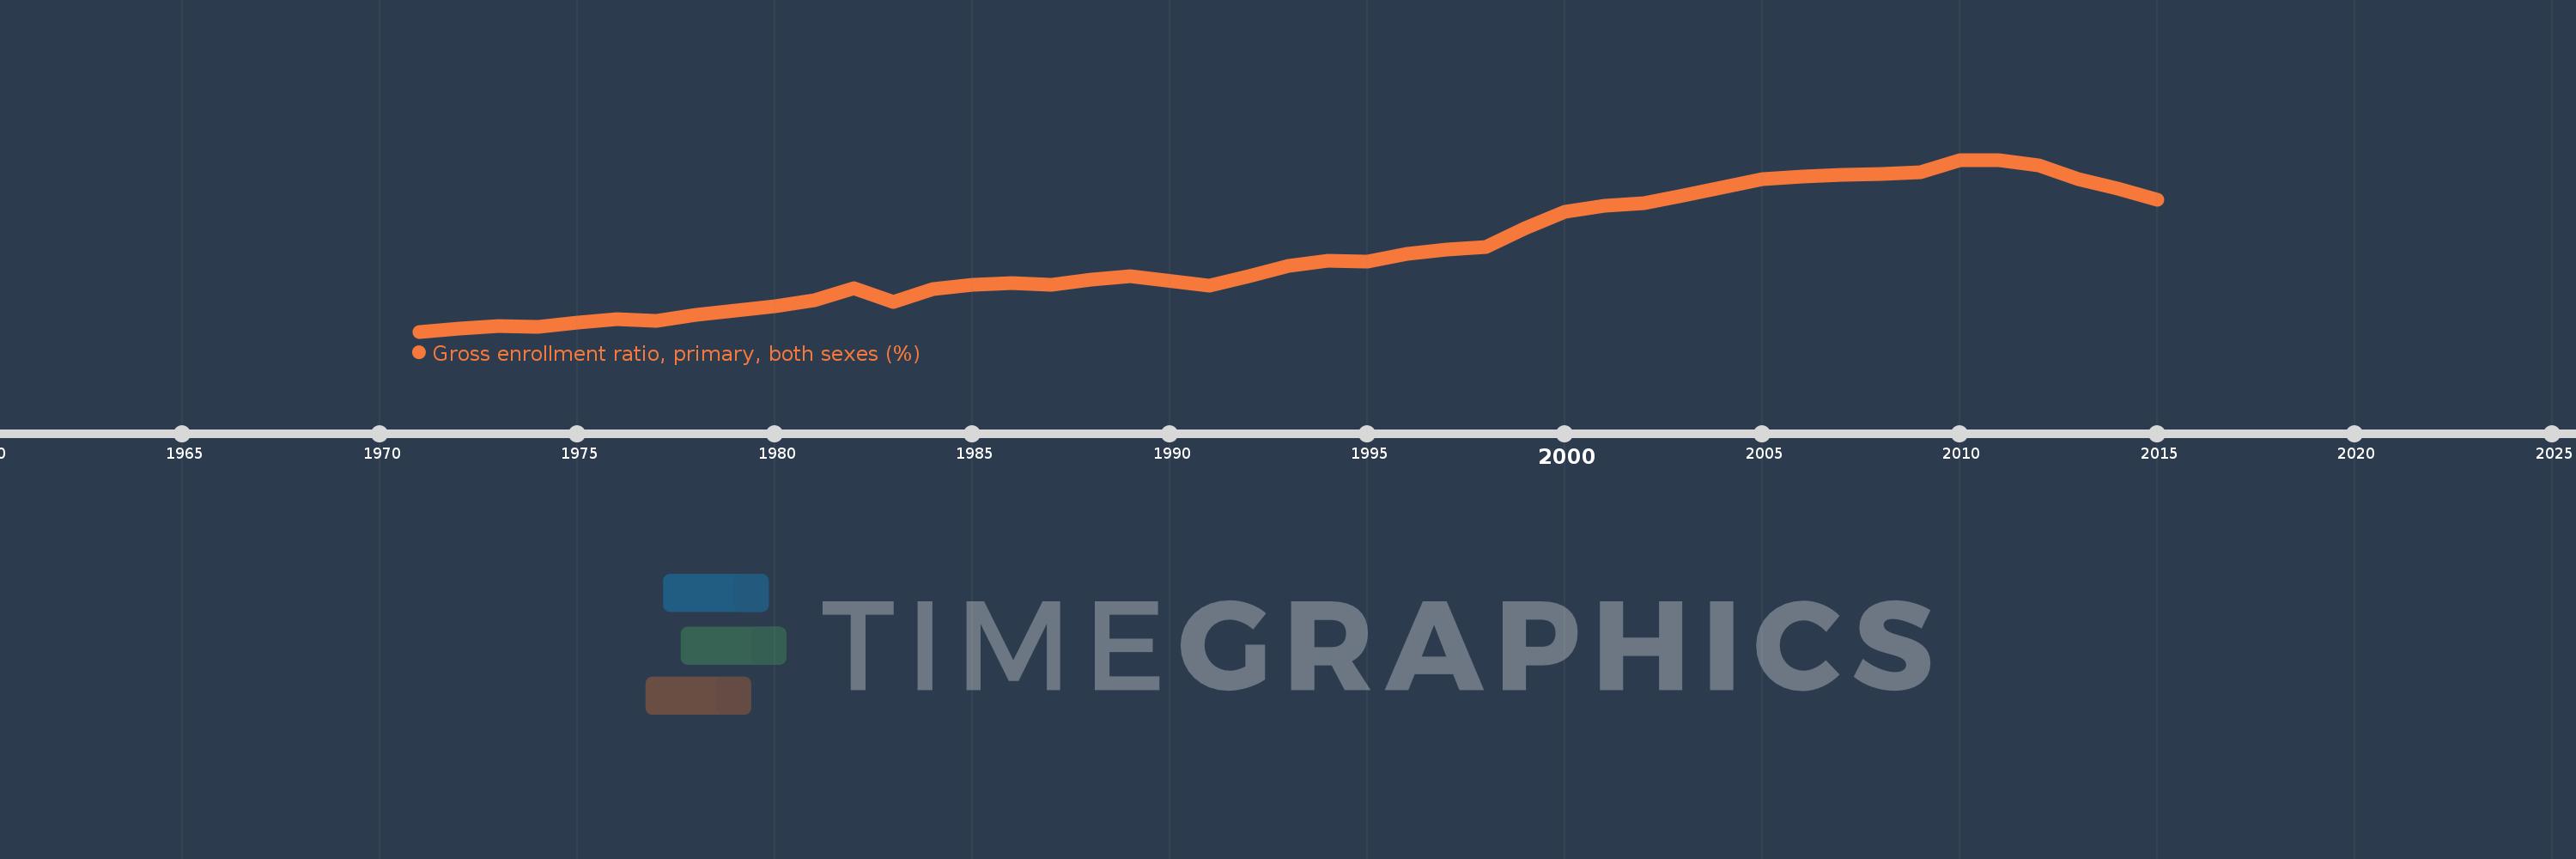
Gross enrollment ratio, primary, both sexes (%)
2015,2014,2013,2012,2011,2010,2009,2008,2007,2006,2005,2003,2002,2001,2000,1999,1998,1997,1996,1995,1994,1993,1992,1991,1989,1988,1987,1986,1985,1984,1983,1982,1981,1980,1979,1978,1977,1976,1975,1974,1973,1972,1971
Cette statistique dans les autres pays:
AfghanistanAlbaniaAlgeriaAndorraAngolaAntigua and BarbudaArab WorldArgentinaArmeniaArubaAustraliaAustriaAzerbaijanBahamas, TheBahrainBangladeshBarbadosBelarusBelgiumBelizeBeninBermudaBhutanBoliviaBosnia and HerzegovinaBotswanaBrazilBritish Virgin IslandsBrunei DarussalamBulgariaBurkina FasoBurundiCabo VerdeCambodiaCameroonCanadaCaribbean small statesCentral African RepublicCentral Europe and the BalticsChadChileChinaColombiaComorosCongo, Dem. Rep.Congo, Rep.Costa RicaCote d'IvoireCroatiaCubaCuracaoCyprusCzech RepublicDenmarkDjiboutiDominicaDominican RepublicEarly-demographic dividendEast Asia & PacificEast Asia & Pacific (excluding high income)East Asia & Pacific (IDA & IBRD countries)EcuadorEgypt, Arab Rep.El SalvadorEquatorial GuineaEritreaEstoniaEthiopiaEuro areaEurope & Central AsiaEurope & Central Asia (excluding high income)Europe & Central Asia (IDA & IBRD countries)European UnionFijiFinlandFragile and conflict affected situationsFranceGabonGambia, TheGeorgiaGermanyGhanaGreeceGrenadaGuatemalaGuineaGuinea-BissauGuyanaHaitiHeavily indebted poor countries (HIPC)High incomeHondurasHong Kong SAR, ChinaHungaryIBRD onlyIcelandIDA & IBRD totalIDA blendIDA onlyIDA totalIndiaIndonesiaIran, Islamic Rep.IraqIrelandIsraelItalyJamaicaJapanJordanKazakhstanKenyaKiribatiKorea, Dem. People’s Rep.Korea, Rep.KuwaitKyrgyz RepublicLao PDRLate-demographic dividendLatin America & Caribbean Latin America & Caribbean (excluding high income)Latin America & the Caribbean (IDA & IBRD countries)LatviaLeast developed countries: UN classificationLebanonLesothoLiberiaLibyaLiechtensteinLithuaniaLow & middle incomeLow incomeLower middle incomeLuxembourgMacao SAR, ChinaMacedonia, FYRMadagascarMalawiMalaysiaMaldivesMaliMaltaMarshall IslandsMauritaniaMauritiusMexicoMicronesia, Fed. Sts.Middle East & North AfricaMiddle East & North Africa (excluding high income)Middle East & North Africa (IDA & IBRD countries)Middle incomeMoldovaMongoliaMontenegroMoroccoMozambiqueMyanmarNamibiaNauruNepalNetherlandsNew ZealandNicaraguaNigerNigeriaNorth AmericaNorwayOECD membersOmanOther small statesPacific island small statesPakistanPalauPanamaPapua New GuineaParaguayPeruPhilippinesPolandPortugalPost-demographic dividendPre-demographic dividendPuerto RicoQatarRomaniaRussian FederationRwandaSamoaSan MarinoSao Tome and PrincipeSaudi ArabiaSenegalSerbiaSeychellesSierra LeoneSlovak RepublicSloveniaSmall statesSolomon IslandsSomaliaSouth AfricaSouth AsiaSouth Asia (IDA & IBRD)South SudanSpainSri LankaSt. Kitts and NevisSt. LuciaSt. Vincent and the GrenadinesSub-Saharan Africa Sub-Saharan Africa (excluding high income)Sub-Saharan Africa (IDA & IBRD countries)SudanSurinameSwazilandSwedenSwitzerlandSyrian Arab RepublicTajikistanTanzaniaThailandTimor-LesteTogoTongaTrinidad and TobagoTunisiaTurkeyTurkmenistanTuvaluUgandaUkraineUnited Arab EmiratesUnited KingdomUnited StatesUpper middle incomeUruguayUzbekistanVanuatuVenezuela, RBVietnamWest Bank and GazaWorldYemen, Rep.ZambiaZimbabwe La ligne de temps
Cette échelle de temps montre un graphique de 1971 année à 2015 année Guatemala. Les données jusqu'à 1970 année ne sont pas présentés. Quantité d'observations actuelles selon dates: 43.
Source (désignation):
Les indicateurs du développement mondiale
Source (organisation):
UNESCO Institute for Statistics
Catégories:
Education
Dernière mise à jour
23 avr. 2017
Les indicateurs de changement de valeurs selon les années
Minimum:
58.501
1 janv. 1971
Maximum:
117.285
1 janv. 2010
Pour la date d''observation
Valeur
Changement absolu
Le changement par rapport à la valeur précédente
1 janv. 1971
58.501
+58.501
0.0%
1 janv. 1972
59.585
+1.084
1.85%
1 janv. 1973
60.445
+0.86
1.44%
1 janv. 1974
60.25
-0.195
-0.32%
1 janv. 1975
61.612
+1.363
2.26%
1 janv. 1976
62.622
+1.009
1.64%
1 janv. 1977
62.123
-0.498
-0.8%
1 janv. 1978
64.176
+2.052
3.3%
1 janv. 1979
65.83
+1.655
2.58%
1 janv. 1980
67.244
+1.414
2.15%
1 janv. 1981
69.345
+2.101
3.12%
1 janv. 1982
73.205
+3.86
5.57%
1 janv. 1983
68.771
-4.434
-6.06%
1 janv. 1984
73.064
+4.293
6.24%
1 janv. 1985
74.594
+1.529
2.09%
1 janv. 1986
75.055
+0.462
0.62%
1 janv. 1987
74.602
-0.453
-0.6%
1 janv. 1988
76.321
+1.719
2.3%
1 janv. 1989
77.47
+1.148
1.5%
1 janv. 1991
74.159
-3.31
-4.27%
1 janv. 1992
77.36
+3.2
4.32%
1 janv. 1993
81.072
+3.712
4.8%
1 janv. 1994
82.707
+1.635
2.02%
1 janv. 1995
82.575
-0.131
-0.16%
1 janv. 1996
85.008
+2.433
2.95%
1 janv. 1997
86.547
+1.539
1.81%
1 janv. 1998
87.431
+0.884
1.02%
1 janv. 1999
93.817
+6.386
7.3%
1 janv. 2000
99.45
+5.632
6.0%
1 janv. 2001
101.602
+2.153
2.16%
1 janv. 2002
102.373
+0.77
0.76%
1 janv. 2003
105.177
+2.805
2.74%
1 janv. 2005
110.558
+5.381
5.12%
1 janv. 2006
111.488
+0.93
0.84%
1 janv. 2007
112.27
+0.782
0.7%
1 janv. 2008
112.404
+0.134
0.12%
1 janv. 2009
113.012
+0.608
0.54%
1 janv. 2010
117.285
+4.273
3.78%
1 janv. 2011
117.007
-0.277
-0.24%
1 janv. 2012
115.426
-1.581
-1.35%
1 janv. 2013
110.675
-4.751
-4.12%
1 janv. 2014
107.549
-3.126
-2.82%
1 janv. 2015
103.592
-3.957
-3.68%
Classement des pays selon les statistiques actuelles par années


Commentaires: