29
/fr/
fr
AIzaSyAYiBZKx7MnpbEhh9jyipgxe19OcubqV5w
April 1, 2024
136778
Gambia, The
GMB
true
2
1
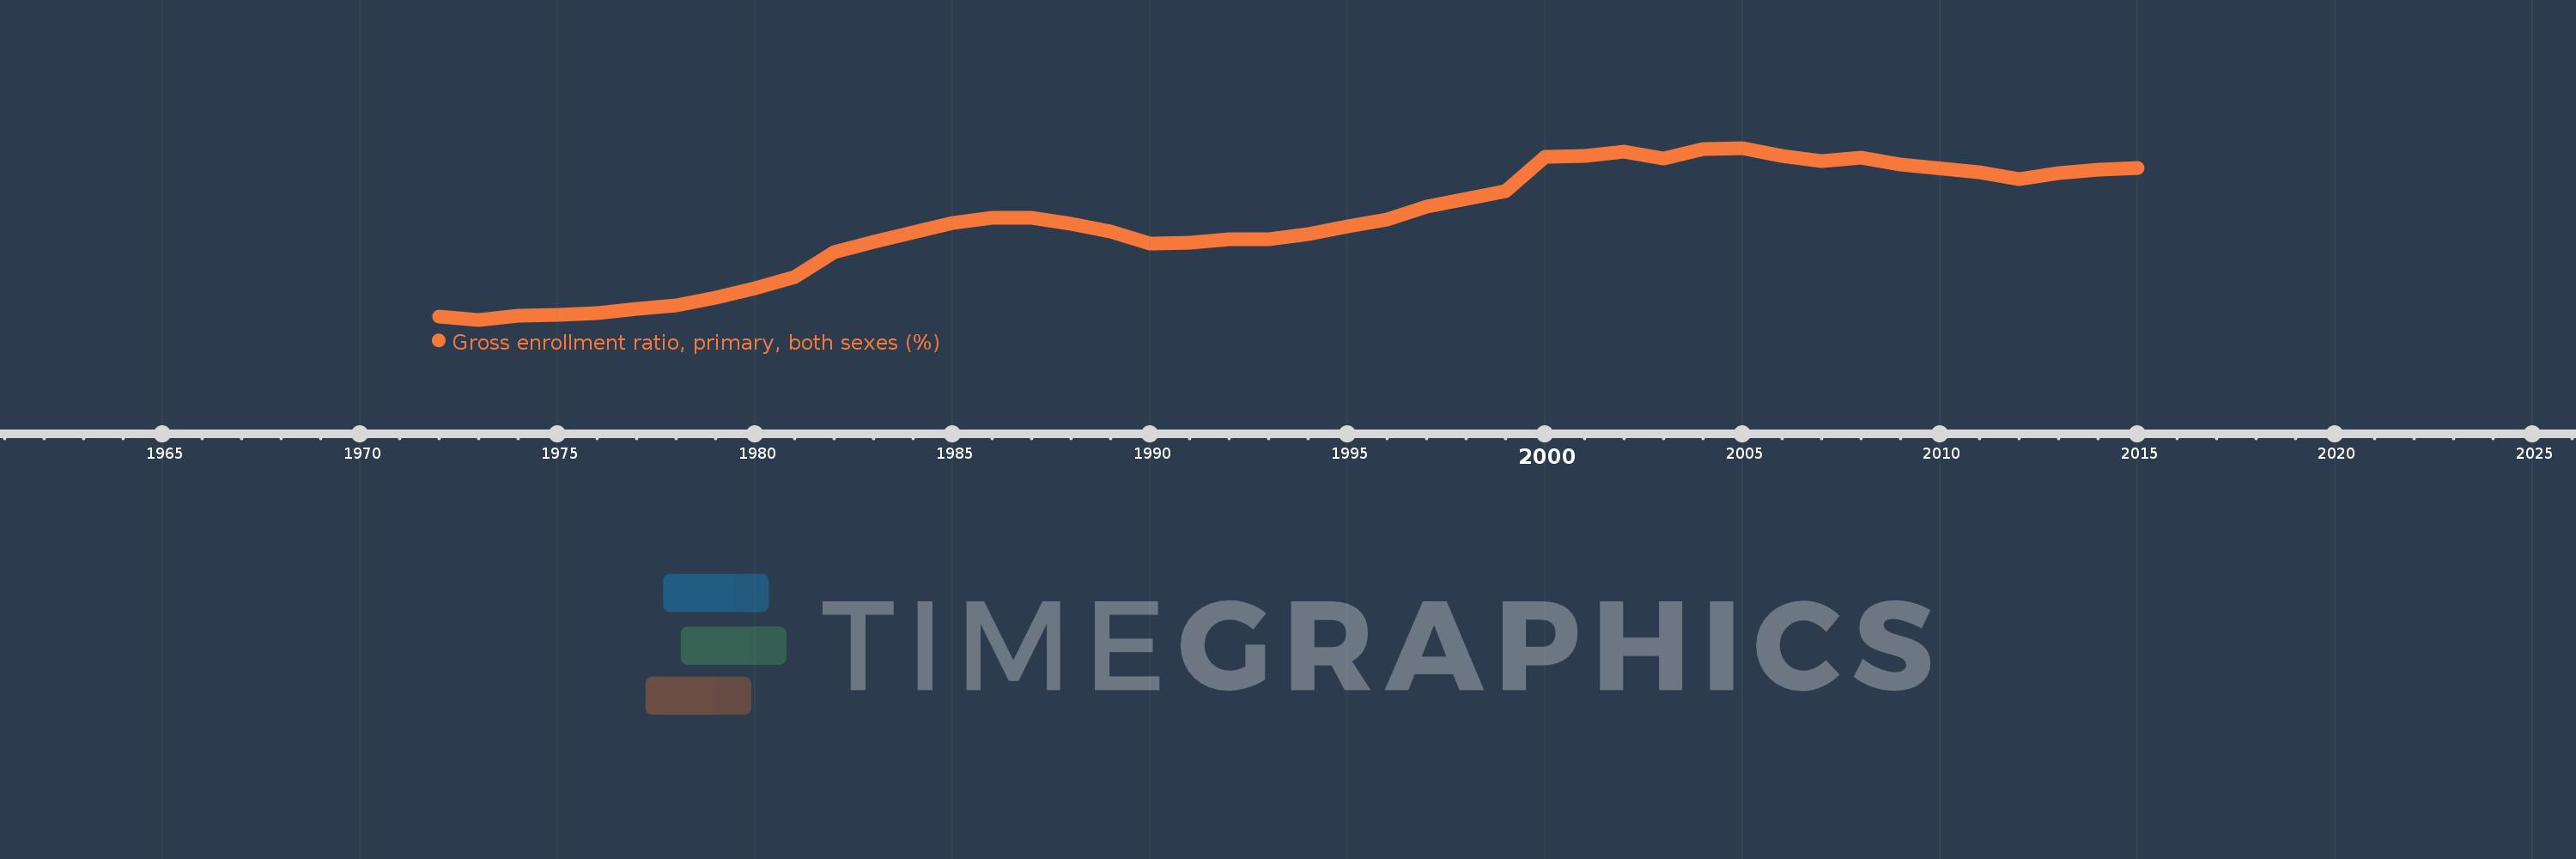
Gross enrollment ratio, primary, both sexes (%)
2015,2014,2013,2012,2011,2009,2008,2007,2006,2005,2004,2003,2002,2001,2000,1999,1998,1997,1996,1995,1994,1993,1992,1991,1990,1989,1988,1987,1986,1985,1984,1983,1982,1981,1980,1979,1978,1977,1976,1975,1974,1973,1972
Cette statistique dans les autres pays:
AfghanistanAlbaniaAlgeriaAndorraAngolaAntigua and BarbudaArab WorldArgentinaArmeniaArubaAustraliaAustriaAzerbaijanBahamas, TheBahrainBangladeshBarbadosBelarusBelgiumBelizeBeninBermudaBhutanBoliviaBosnia and HerzegovinaBotswanaBrazilBritish Virgin IslandsBrunei DarussalamBulgariaBurkina FasoBurundiCabo VerdeCambodiaCameroonCanadaCaribbean small statesCentral African RepublicCentral Europe and the BalticsChadChileChinaColombiaComorosCongo, Dem. Rep.Congo, Rep.Costa RicaCote d'IvoireCroatiaCubaCuracaoCyprusCzech RepublicDenmarkDjiboutiDominicaDominican RepublicEarly-demographic dividendEast Asia & PacificEast Asia & Pacific (excluding high income)East Asia & Pacific (IDA & IBRD countries)EcuadorEgypt, Arab Rep.El SalvadorEquatorial GuineaEritreaEstoniaEthiopiaEuro areaEurope & Central AsiaEurope & Central Asia (excluding high income)Europe & Central Asia (IDA & IBRD countries)European UnionFijiFinlandFragile and conflict affected situationsFranceGabonGambia, TheGeorgiaGermanyGhanaGreeceGrenadaGuatemalaGuineaGuinea-BissauGuyanaHaitiHeavily indebted poor countries (HIPC)High incomeHondurasHong Kong SAR, ChinaHungaryIBRD onlyIcelandIDA & IBRD totalIDA blendIDA onlyIDA totalIndiaIndonesiaIran, Islamic Rep.IraqIrelandIsraelItalyJamaicaJapanJordanKazakhstanKenyaKiribatiKorea, Dem. People’s Rep.Korea, Rep.KuwaitKyrgyz RepublicLao PDRLate-demographic dividendLatin America & Caribbean Latin America & Caribbean (excluding high income)Latin America & the Caribbean (IDA & IBRD countries)LatviaLeast developed countries: UN classificationLebanonLesothoLiberiaLibyaLiechtensteinLithuaniaLow & middle incomeLow incomeLower middle incomeLuxembourgMacao SAR, ChinaMacedonia, FYRMadagascarMalawiMalaysiaMaldivesMaliMaltaMarshall IslandsMauritaniaMauritiusMexicoMicronesia, Fed. Sts.Middle East & North AfricaMiddle East & North Africa (excluding high income)Middle East & North Africa (IDA & IBRD countries)Middle incomeMoldovaMongoliaMontenegroMoroccoMozambiqueMyanmarNamibiaNauruNepalNetherlandsNew ZealandNicaraguaNigerNigeriaNorth AmericaNorwayOECD membersOmanOther small statesPacific island small statesPakistanPalauPanamaPapua New GuineaParaguayPeruPhilippinesPolandPortugalPost-demographic dividendPre-demographic dividendPuerto RicoQatarRomaniaRussian FederationRwandaSamoaSan MarinoSao Tome and PrincipeSaudi ArabiaSenegalSerbiaSeychellesSierra LeoneSlovak RepublicSloveniaSmall statesSolomon IslandsSomaliaSouth AfricaSouth AsiaSouth Asia (IDA & IBRD)South SudanSpainSri LankaSt. Kitts and NevisSt. LuciaSt. Vincent and the GrenadinesSub-Saharan Africa Sub-Saharan Africa (excluding high income)Sub-Saharan Africa (IDA & IBRD countries)SudanSurinameSwazilandSwedenSwitzerlandSyrian Arab RepublicTajikistanTanzaniaThailandTimor-LesteTogoTongaTrinidad and TobagoTunisiaTurkeyTurkmenistanTuvaluUgandaUkraineUnited Arab EmiratesUnited KingdomUnited StatesUpper middle incomeUruguayUzbekistanVanuatuVenezuela, RBVietnamWest Bank and GazaWorldYemen, Rep.ZambiaZimbabwe La ligne de temps
Cette échelle de temps montre un graphique de 1972 année à 2015 année Gambia, The. Les données jusqu'à 1971 année ne sont pas présentés. Quantité d'observations actuelles selon dates: 43.
Source (désignation):
Les indicateurs du développement mondiale
Source (organisation):
UNESCO Institute for Statistics
Catégories:
Education
Dernière mise à jour
23 avr. 2017
Les indicateurs de changement de valeurs selon les années
Minimum:
27.225
1 janv. 1973
Maximum:
93.665
1 janv. 2005
Pour la date d''observation
Valeur
Changement absolu
Le changement par rapport à la valeur précédente
1 janv. 1972
28.401
+28.401
0.0%
1 janv. 1973
27.225
-1.176
-4.14%
1 janv. 1974
28.663
+1.438
5.28%
1 janv. 1975
29.055
+0.392
1.37%
1 janv. 1976
29.923
+0.868
2.99%
1 janv. 1977
31.357
+1.434
4.79%
1 janv. 1978
32.74
+1.383
4.41%
1 janv. 1979
35.696
+2.956
9.03%
1 janv. 1980
39.465
+3.769
10.56%
1 janv. 1981
43.886
+4.421
11.2%
1 janv. 1982
53.328
+9.442
21.51%
1 janv. 1983
57.509
+4.181
7.84%
1 janv. 1984
60.981
+3.471
6.04%
1 janv. 1985
64.825
+3.844
6.3%
1 janv. 1986
66.79
+1.966
3.03%
1 janv. 1987
66.741
-0.049
-0.07%
1 janv. 1988
64.427
-2.314
-3.47%
1 janv. 1989
61.263
-3.164
-4.91%
1 janv. 1990
56.841
-4.422
-7.22%
1 janv. 1991
57.183
+0.342
0.6%
1 janv. 1992
58.406
+1.223
2.14%
1 janv. 1993
58.496
+0.09
0.15%
1 janv. 1994
60.283
+1.787
3.05%
1 janv. 1995
63.172
+2.889
4.79%
1 janv. 1996
65.923
+2.751
4.36%
1 janv. 1997
70.855
+4.932
7.48%
1 janv. 1998
74.13
+3.275
4.62%
1 janv. 1999
76.856
+2.726
3.68%
1 janv. 2000
90.361
+13.505
17.57%
1 janv. 2001
90.49
+0.129
0.14%
1 janv. 2002
92.096
+1.606
1.78%
1 janv. 2003
89.536
-2.561
-2.78%
1 janv. 2004
93.085
+3.549
3.96%
1 janv. 2005
93.665
+0.581
0.62%
1 janv. 2006
90.703
-2.963
-3.16%
1 janv. 2007
88.545
-2.158
-2.38%
1 janv. 2008
89.778
+1.233
1.39%
1 janv. 2009
87.353
-2.424
-2.7%
1 janv. 2011
84.351
-3.002
-3.44%
1 janv. 2012
81.472
-2.88
-3.41%
1 janv. 2013
84.013
+2.542
3.12%
1 janv. 2014
85.168
+1.155
1.37%
1 janv. 2015
85.765
+0.597
0.7%
Classement des pays selon les statistiques actuelles par années


Commentaires: