29
/fr/
fr
AIzaSyAYiBZKx7MnpbEhh9jyipgxe19OcubqV5w
April 1, 2024
135571
Gabon
GAB
true
2
1
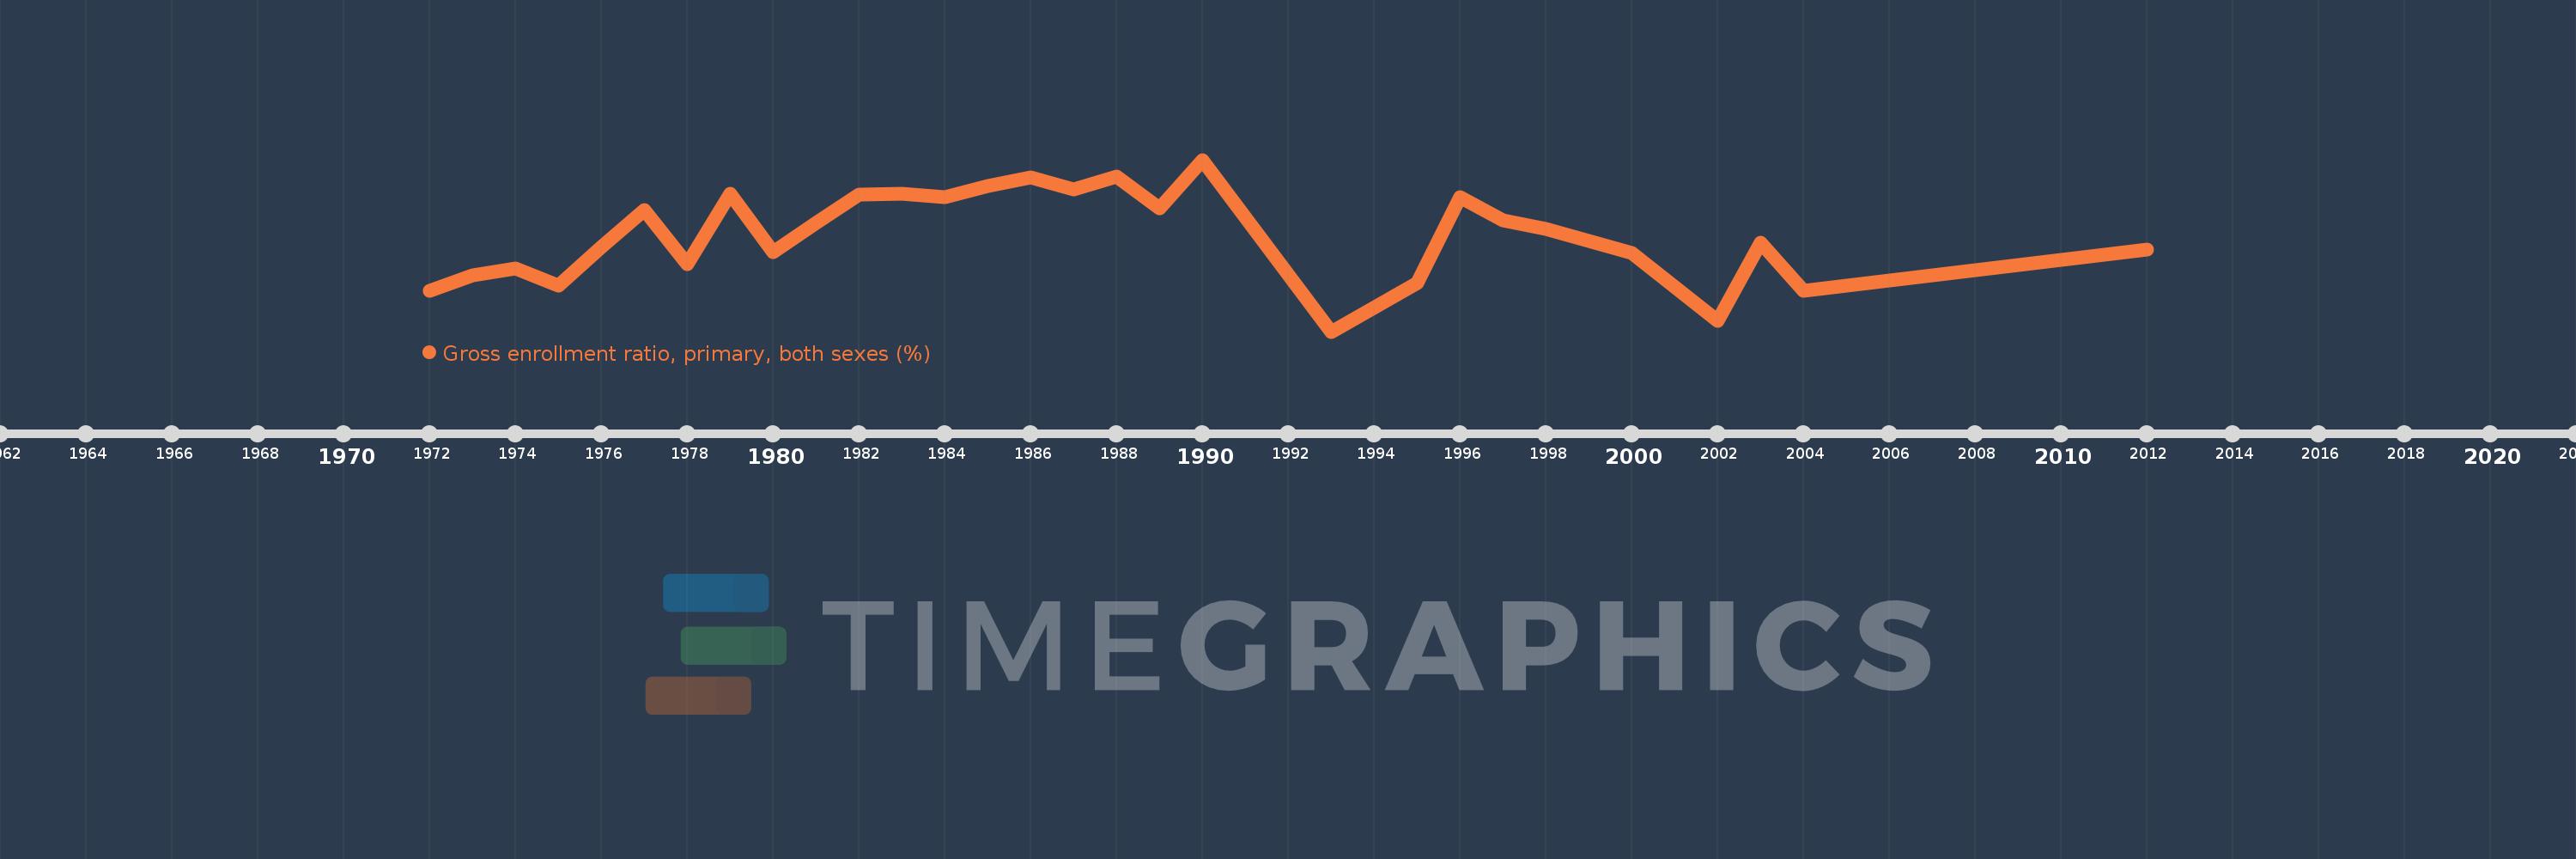
Gross enrollment ratio, primary, both sexes (%)
2012,2004,2003,2002,2000,1998,1997,1996,1995,1993,1990,1989,1988,1987,1986,1985,1984,1983,1982,1981,1980,1979,1978,1977,1976,1975,1974,1973,1972
Cette statistique dans les autres pays:
AfghanistanAlbaniaAlgeriaAndorraAngolaAntigua and BarbudaArab WorldArgentinaArmeniaArubaAustraliaAustriaAzerbaijanBahamas, TheBahrainBangladeshBarbadosBelarusBelgiumBelizeBeninBermudaBhutanBoliviaBosnia and HerzegovinaBotswanaBrazilBritish Virgin IslandsBrunei DarussalamBulgariaBurkina FasoBurundiCabo VerdeCambodiaCameroonCanadaCaribbean small statesCentral African RepublicCentral Europe and the BalticsChadChileChinaColombiaComorosCongo, Dem. Rep.Congo, Rep.Costa RicaCote d'IvoireCroatiaCubaCuracaoCyprusCzech RepublicDenmarkDjiboutiDominicaDominican RepublicEarly-demographic dividendEast Asia & PacificEast Asia & Pacific (excluding high income)East Asia & Pacific (IDA & IBRD countries)EcuadorEgypt, Arab Rep.El SalvadorEquatorial GuineaEritreaEstoniaEthiopiaEuro areaEurope & Central AsiaEurope & Central Asia (excluding high income)Europe & Central Asia (IDA & IBRD countries)European UnionFijiFinlandFragile and conflict affected situationsFranceGabonGambia, TheGeorgiaGermanyGhanaGreeceGrenadaGuatemalaGuineaGuinea-BissauGuyanaHaitiHeavily indebted poor countries (HIPC)High incomeHondurasHong Kong SAR, ChinaHungaryIBRD onlyIcelandIDA & IBRD totalIDA blendIDA onlyIDA totalIndiaIndonesiaIran, Islamic Rep.IraqIrelandIsraelItalyJamaicaJapanJordanKazakhstanKenyaKiribatiKorea, Dem. People’s Rep.Korea, Rep.KuwaitKyrgyz RepublicLao PDRLate-demographic dividendLatin America & Caribbean Latin America & Caribbean (excluding high income)Latin America & the Caribbean (IDA & IBRD countries)LatviaLeast developed countries: UN classificationLebanonLesothoLiberiaLibyaLiechtensteinLithuaniaLow & middle incomeLow incomeLower middle incomeLuxembourgMacao SAR, ChinaMacedonia, FYRMadagascarMalawiMalaysiaMaldivesMaliMaltaMarshall IslandsMauritaniaMauritiusMexicoMicronesia, Fed. Sts.Middle East & North AfricaMiddle East & North Africa (excluding high income)Middle East & North Africa (IDA & IBRD countries)Middle incomeMoldovaMongoliaMontenegroMoroccoMozambiqueMyanmarNamibiaNauruNepalNetherlandsNew ZealandNicaraguaNigerNigeriaNorth AmericaNorwayOECD membersOmanOther small statesPacific island small statesPakistanPalauPanamaPapua New GuineaParaguayPeruPhilippinesPolandPortugalPost-demographic dividendPre-demographic dividendPuerto RicoQatarRomaniaRussian FederationRwandaSamoaSan MarinoSao Tome and PrincipeSaudi ArabiaSenegalSerbiaSeychellesSierra LeoneSlovak RepublicSloveniaSmall statesSolomon IslandsSomaliaSouth AfricaSouth AsiaSouth Asia (IDA & IBRD)South SudanSpainSri LankaSt. Kitts and NevisSt. LuciaSt. Vincent and the GrenadinesSub-Saharan Africa Sub-Saharan Africa (excluding high income)Sub-Saharan Africa (IDA & IBRD countries)SudanSurinameSwazilandSwedenSwitzerlandSyrian Arab RepublicTajikistanTanzaniaThailandTimor-LesteTogoTongaTrinidad and TobagoTunisiaTurkeyTurkmenistanTuvaluUgandaUkraineUnited Arab EmiratesUnited KingdomUnited StatesUpper middle incomeUruguayUzbekistanVanuatuVenezuela, RBVietnamWest Bank and GazaWorldYemen, Rep.ZambiaZimbabwe La ligne de temps
Cette échelle de temps montre un graphique de 1972 année à 2012 année Gabon. Les données jusqu'à 1971 année ne sont pas présentés. Quantité d'observations actuelles selon dates: 29.
Source (désignation):
Les indicateurs du développement mondiale
Source (organisation):
UNESCO Institute for Statistics
Catégories:
Education
Dernière mise à jour
23 avr. 2017
Les indicateurs de changement de valeurs selon les années
Minimum:
135.969
1 janv. 1993
Maximum:
148.539
1 janv. 1990
Pour la date d''observation
Valeur
Changement absolu
Le changement par rapport à la valeur précédente
1 janv. 1972
138.962
+138.962
0.0%
1 janv. 1973
140.097
+1.135
0.82%
1 janv. 1974
140.565
+0.468
0.33%
1 janv. 1975
139.305
-1.26
-0.9%
1 janv. 1976
142.176
+2.871
2.06%
1 janv. 1977
144.862
+2.686
1.89%
1 janv. 1978
140.933
-3.929
-2.71%
1 janv. 1979
146.084
+5.151
3.66%
1 janv. 1980
141.77
-4.314
-2.95%
1 janv. 1981
143.929
+2.158
1.52%
1 janv. 1982
145.963
+2.034
1.41%
1 janv. 1983
146.052
+0.089
0.06%
1 janv. 1984
145.804
-0.248
-0.17%
1 janv. 1985
146.606
+0.802
0.55%
1 janv. 1986
147.238
+0.631
0.43%
1 janv. 1987
146.379
-0.859
-0.58%
1 janv. 1988
147.324
+0.946
0.65%
1 janv. 1989
145.008
-2.316
-1.57%
1 janv. 1990
148.539
+3.531
2.43%
1 janv. 1993
135.969
-12.57
-8.46%
1 janv. 1995
139.546
+3.577
2.63%
1 janv. 1996
145.793
+6.247
4.48%
1 janv. 1997
144.099
-1.694
-1.16%
1 janv. 1998
143.452
-0.647
-0.45%
1 janv. 2000
141.736
-1.716
-1.2%
1 janv. 2002
136.786
-4.95
-3.49%
1 janv. 2003
142.463
+5.677
4.15%
1 janv. 2004
138.977
-3.486
-2.45%
1 janv. 2012
141.993
+3.017
2.17%
Classement des pays selon les statistiques actuelles par années


Commentaires: