29
/fr/
fr
AIzaSyAYiBZKx7MnpbEhh9jyipgxe19OcubqV5w
April 1, 2024
94909
Burkina Faso
BFA
true
2
1
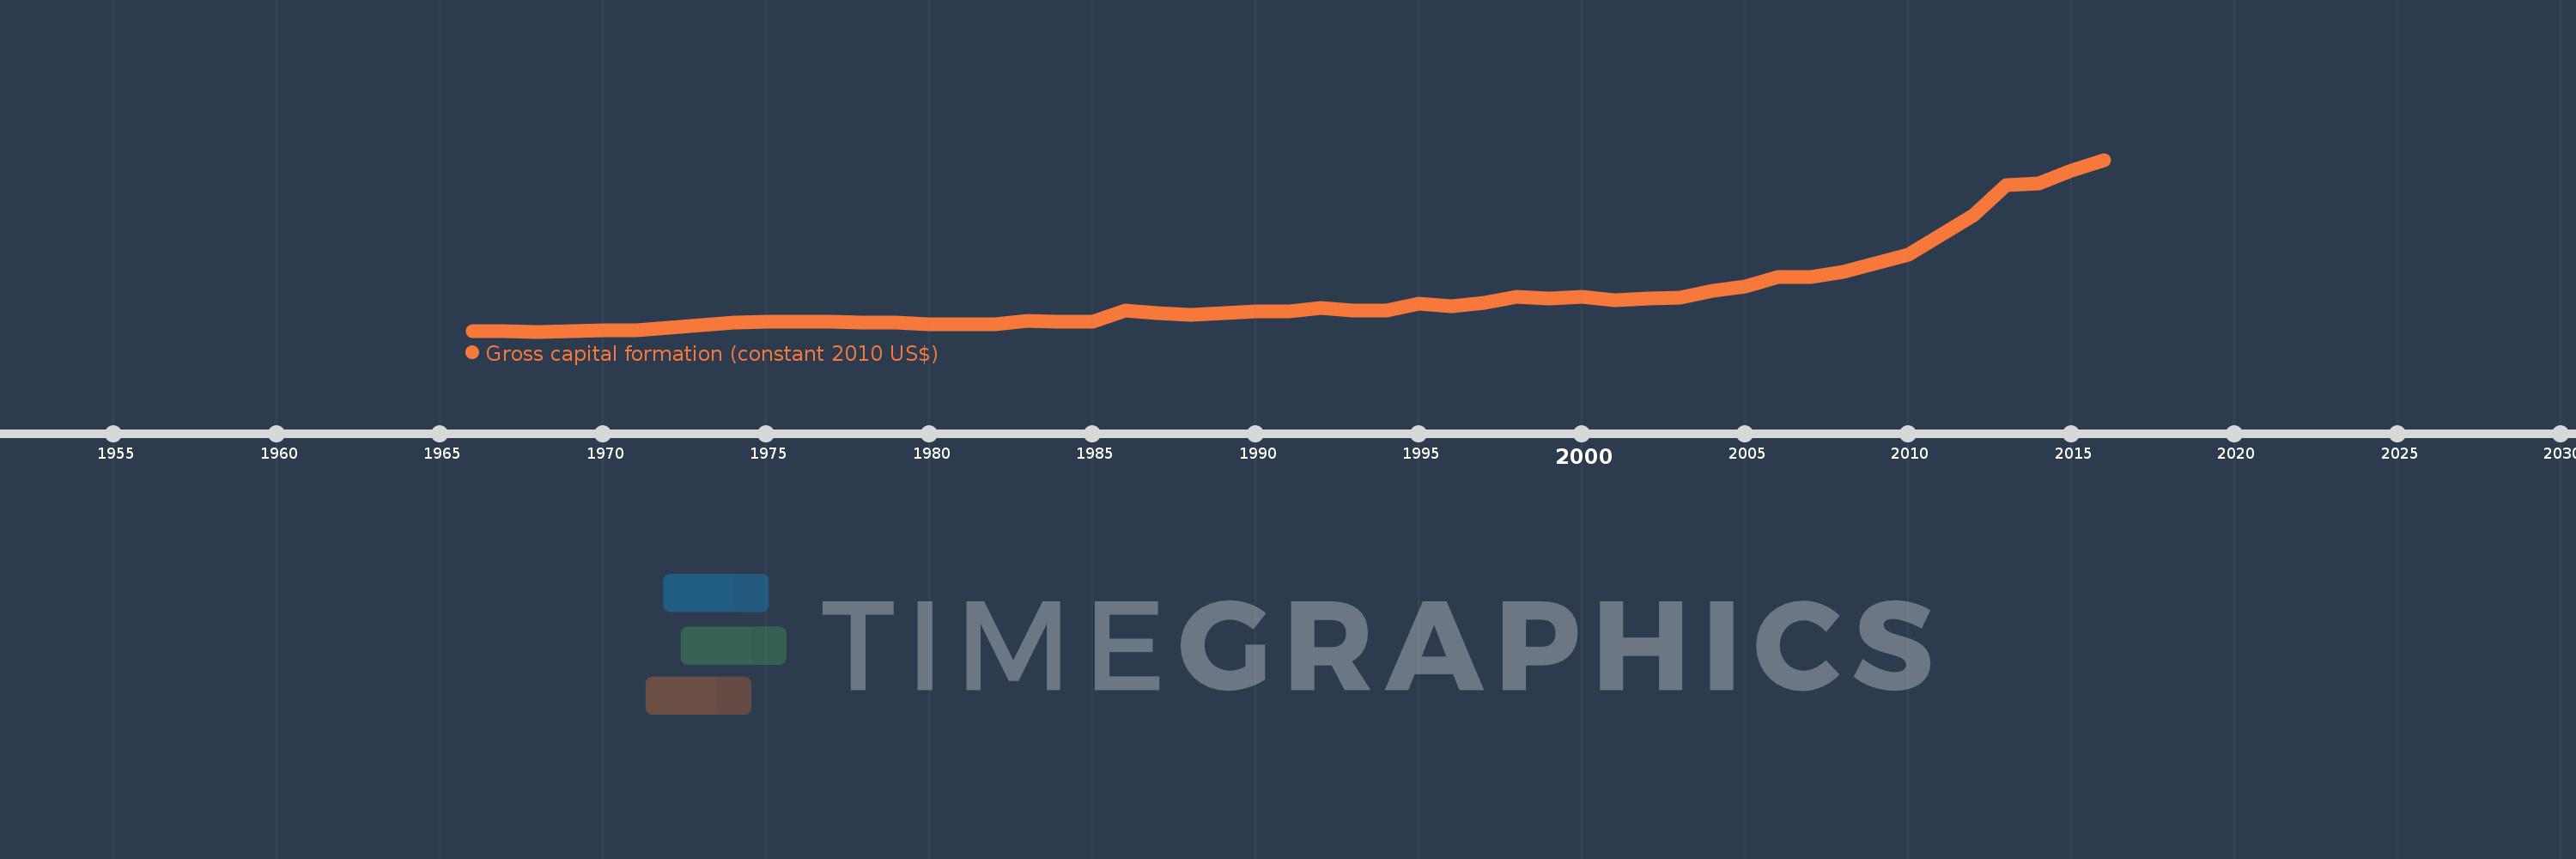
Gross capital formation (constant 2010 US$)
2016,2015,2014,2013,2012,2011,2010,2009,2008,2007,2006,2005,2004,2003,2002,2001,2000,1999,1998,1997,1996,1995,1994,1993,1992,1991,1990,1989,1988,1987,1986,1985,1984,1983,1982,1981,1980,1979,1978,1977,1976,1975,1974,1973,1972,1971,1970,1969,1968,1967,1966
Cette statistique dans les autres pays:
AfghanistanAlbaniaAlgeriaAngolaAntigua and BarbudaArab WorldArgentinaArmeniaArubaAustraliaAustriaAzerbaijanBahamas, TheBahrainBangladeshBarbadosBelarusBelgiumBelizeBeninBermudaBhutanBoliviaBosnia and HerzegovinaBotswanaBrazilBrunei DarussalamBulgariaBurkina FasoBurundiCabo VerdeCambodiaCameroonCanadaCaribbean small statesCentral African RepublicCentral Europe and the BalticsChadChileChinaColombiaComorosCongo, Dem. Rep.Congo, Rep.Cote d'IvoireCroatiaCubaCyprusCzech RepublicDenmarkDominicaDominican RepublicEarly-demographic dividendEast Asia & PacificEast Asia & Pacific (excluding high income)East Asia & Pacific (IDA & IBRD countries)EcuadorEgypt, Arab Rep.El SalvadorEquatorial GuineaEritreaEstoniaEthiopiaEuro areaEurope & Central AsiaEurope & Central Asia (excluding high income)Europe & Central Asia (IDA & IBRD countries)European UnionFaroe IslandsFinlandFragile and conflict affected situationsFranceGabonGambia, TheGeorgiaGermanyGhanaGreeceGrenadaGuatemalaGuineaGuinea-BissauGuyanaHaitiHeavily indebted poor countries (HIPC)High incomeHondurasHong Kong SAR, ChinaHungaryIBRD onlyIcelandIDA & IBRD totalIDA blendIDA onlyIDA totalIndiaIndonesiaIran, Islamic Rep.IraqIrelandIsraelItalyJamaicaJapanJordanKazakhstanKenyaKorea, Rep.KosovoKuwaitKyrgyz RepublicLao PDRLate-demographic dividendLatin America & Caribbean Latin America & Caribbean (excluding high income)Latin America & the Caribbean (IDA & IBRD countries)LatviaLeast developed countries: UN classificationLebanonLiberiaLithuaniaLow & middle incomeLow incomeLower middle incomeLuxembourgMacao SAR, ChinaMacedonia, FYRMadagascarMalawiMalaysiaMaliMaltaMauritaniaMauritiusMexicoMiddle East & North AfricaMiddle East & North Africa (excluding high income)Middle East & North Africa (IDA & IBRD countries)Middle incomeMoldovaMongoliaMontenegroMoroccoMozambiqueNamibiaNepalNetherlandsNew ZealandNicaraguaNigerNigeriaNorth AmericaNorwayOECD membersOmanOther small statesPakistanPanamaParaguayPeruPhilippinesPolandPortugalPost-demographic dividendPre-demographic dividendPuerto RicoQatarRomaniaRussian FederationRwandaSaudi ArabiaSenegalSerbiaSeychellesSierra LeoneSingaporeSlovak RepublicSloveniaSmall statesSouth AfricaSouth AsiaSouth Asia (IDA & IBRD)South SudanSpainSri LankaSt. Kitts and NevisSt. LuciaSt. Vincent and the GrenadinesSub-Saharan Africa Sub-Saharan Africa (excluding high income)Sub-Saharan Africa (IDA & IBRD countries)SudanSurinameSwazilandSwedenSwitzerlandTajikistanTanzaniaThailandTimor-LesteTogoTongaTrinidad and TobagoTunisiaTurkeyTurkmenistanUgandaUkraineUnited Arab EmiratesUnited KingdomUnited StatesUpper middle incomeUruguayUzbekistanVanuatuVenezuela, RBVietnamWest Bank and GazaWorldYemen, Rep.ZambiaZimbabwe La ligne de temps
Cette échelle de temps montre un graphique de 1966 année à 2016 année Burkina Faso. Les données jusqu'à 1965 année ne sont pas présentés. Quantité d'observations actuelles selon dates: 51.
Source (désignation):
Les indicateurs du développement mondiale
Source (organisation):
World Bank national accounts data, and OECD National Accounts data files.
Catégories:
Economy & Growth
Dernière mise à jour
23 avr. 2017
Les indicateurs de changement de valeurs selon les années
Minimum:
117.295 mln.
1 janv. 1968
Maximum:
4.21 mds
1 janv. 2016
Pour la date d''observation
Valeur
Changement absolu
Le changement par rapport à la valeur précédente
1 janv. 1966
125.218 mln.
+125.218 mln.
0.0%
1 janv. 1967
125.223 mln.
+4.812 milles
0.0%
1 janv. 1968
117.295 mln.
-7.928 mln.
-6.33%
1 janv. 1969
123.634 mln.
+6.339 mln.
5.4%
1 janv. 1970
148.997 mln.
+25.363 mln.
20.51%
1 janv. 1971
155.336 mln.
+6.339 mln.
4.25%
1 janv. 1972
218.961 mln.
+63.625 mln.
40.96%
1 janv. 1973
279.253 mln.
+60.292 mln.
27.54%
1 janv. 1974
326.857 mln.
+47.604 mln.
17.05%
1 janv. 1975
361.758 mln.
+34.901 mln.
10.68%
1 janv. 1976
358.587 mln.
-3.172 mln.
-0.88%
1 janv. 1977
361.758 mln.
+3.172 mln.
0.88%
1 janv. 1978
330.029 mln.
-31.73 mln.
-8.77%
1 janv. 1979
341.133 mln.
+11.105 mln.
3.36%
1 janv. 1980
283.782 mln.
-57.352 mln.
-16.81%
1 janv. 1981
289.587 mln.
+5.805 mln.
2.05%
1 janv. 1982
289.002 mln.
-585.418 milles
-0.2%
1 janv. 1983
377.902 mln.
+88.9 mln.
30.76%
1 janv. 1984
348.578 mln.
-29.324 mln.
-7.76%
1 janv. 1985
354.267 mln.
+5.689 mln.
1.63%
1 janv. 1986
626.601 mln.
+272.334 mln.
76.87%
1 janv. 1987
552.024 mln.
-74.578 mln.
-11.9%
1 janv. 1988
524.784 mln.
-27.24 mln.
-4.93%
1 janv. 1989
563.342 mln.
+38.558 mln.
7.35%
1 janv. 1990
592.972 mln.
+29.63 mln.
5.26%
1 janv. 1991
599.572 mln.
+6.6 mln.
1.11%
1 janv. 1992
684.597 mln.
+85.025 mln.
14.18%
1 janv. 1993
614.185 mln.
-70.412 mln.
-10.29%
1 janv. 1994
619.917 mln.
+5.732 mln.
0.93%
1 janv. 1995
774.717 mln.
+154.8 mln.
24.97%
1 janv. 1996
713.805 mln.
-60.912 mln.
-7.86%
1 janv. 1997
806.92 mln.
+93.114 mln.
13.04%
1 janv. 1998
947.391 mln.
+140.472 mln.
17.41%
1 janv. 1999
914.638 mln.
-32.753 mln.
-3.46%
1 janv. 2000
953.063 mln.
+38.425 mln.
4.2%
1 janv. 2001
857.518 mln.
-95.545 mln.
-10.03%
1 janv. 2002
913.36 mln.
+55.842 mln.
6.51%
1 janv. 2003
918.233 mln.
+4.874 mln.
0.53%
1 janv. 2004
1.084 mds
+166.262 mln.
18.11%
1 janv. 2005
1.191 mds
+106.776 mln.
9.85%
1 janv. 2006
1.409 mds
+217.573 mln.
18.26%
1 janv. 2007
1.409 mds
+483.975 milles
0.03%
1 janv. 2008
1.542 mds
+132.903 mln.
9.43%
1 janv. 2009
1.735 mds
+192.999 mln.
12.51%
1 janv. 2010
1.955 mds
+220.215 mln.
12.69%
1 janv. 2011
2.421 mds
+465.268 mln.
23.79%
1 janv. 2012
2.889 mds
+468.427 mln.
19.35%
1 janv. 2013
3.608 mds
+718.942 mln.
24.88%
1 janv. 2014
3.643 mds
+34.964 mln.
0.97%
1 janv. 2015
3.949 mds
+305.645 mln.
8.39%
1 janv. 2016
4.21 mds
+261.23 mln.
6.62%
Classement des pays selon les statistiques actuelles par années


Commentaires: