29
/fr/
fr
AIzaSyAYiBZKx7MnpbEhh9jyipgxe19OcubqV5w
April 1, 2024
248758
Sri Lanka
LKA
true
2
1
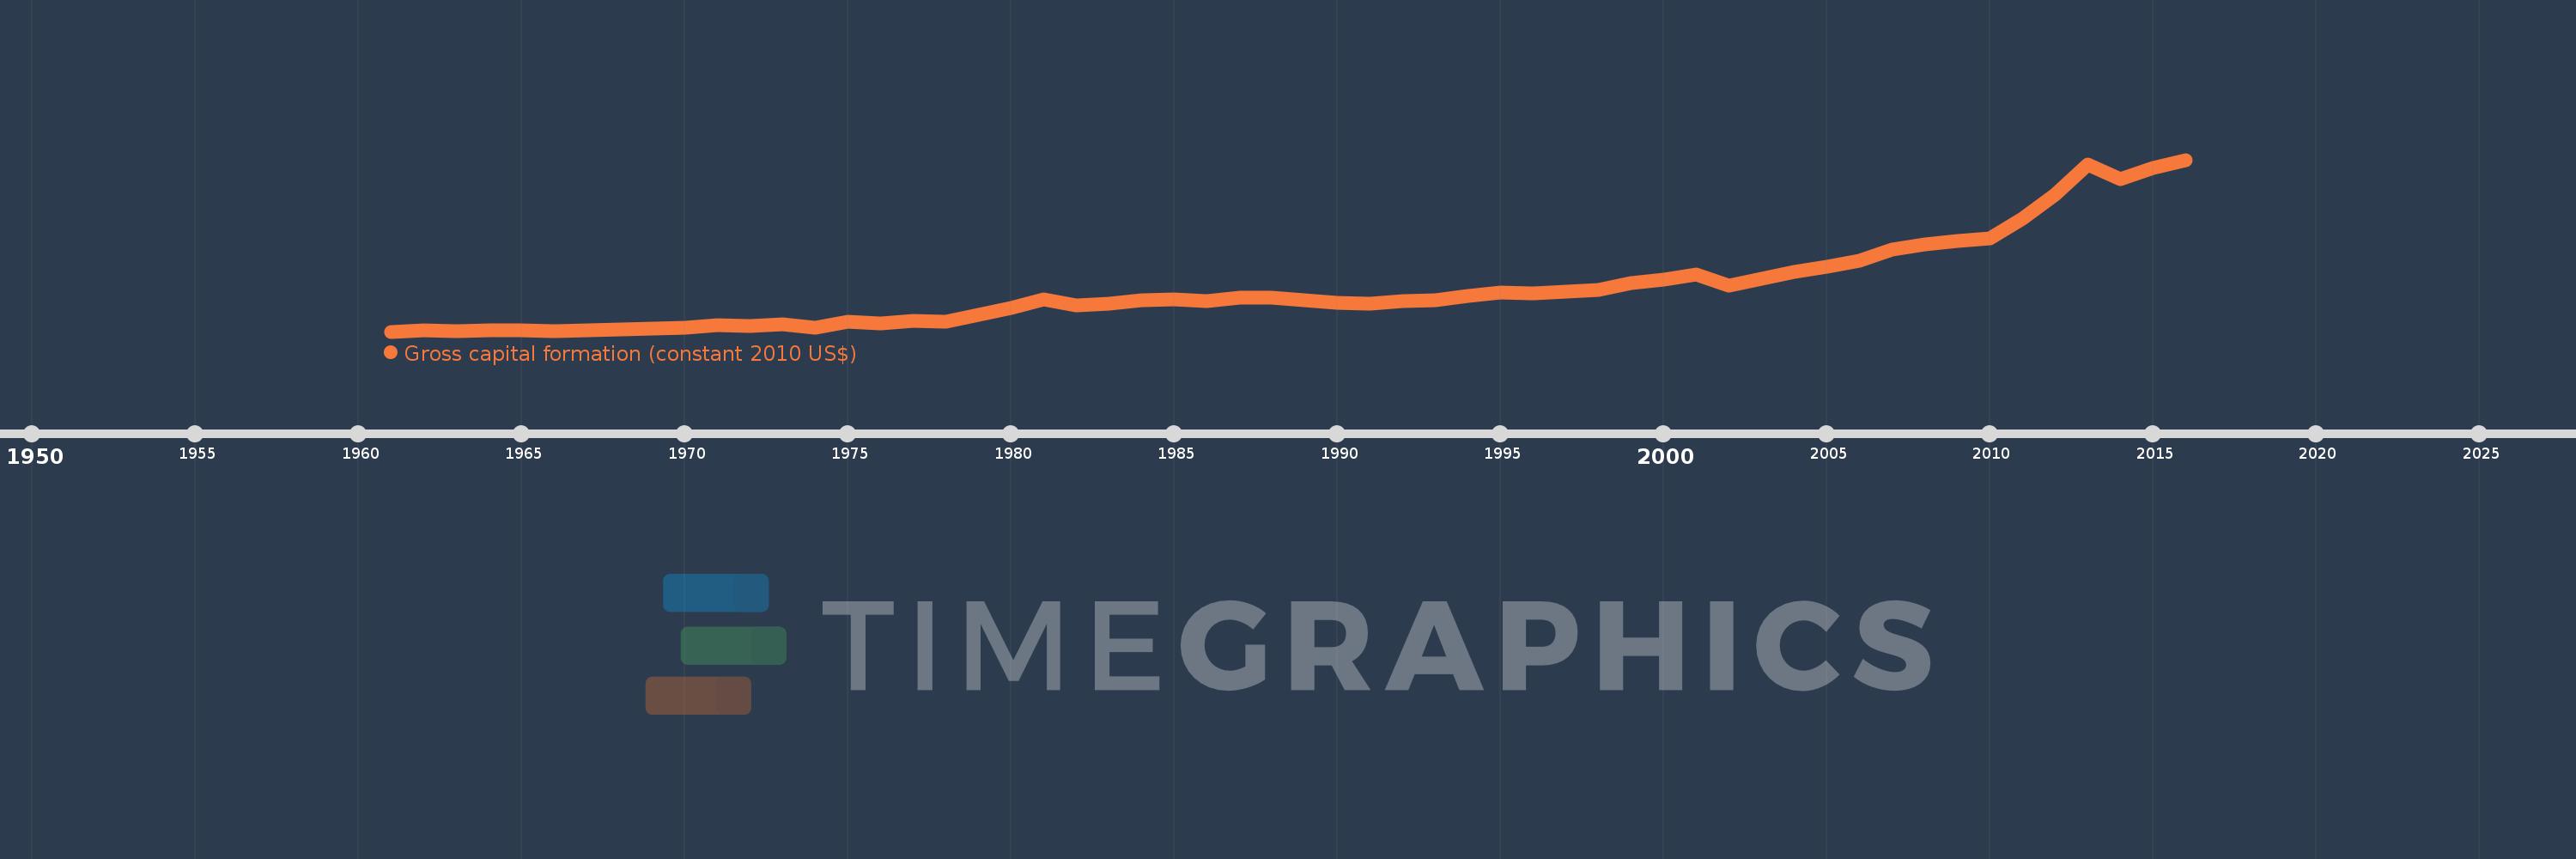
Gross capital formation (constant 2010 US$)
2016,2015,2014,2013,2012,2011,2010,2009,2008,2007,2006,2005,2004,2003,2002,2001,2000,1999,1998,1997,1996,1995,1994,1993,1992,1991,1990,1989,1988,1987,1986,1985,1984,1983,1982,1981,1980,1979,1978,1977,1976,1975,1974,1973,1972,1971,1970,1969,1968,1967,1966,1965,1964,1963,1962,1961
Cette statistique dans les autres pays:
AfghanistanAlbaniaAlgeriaAngolaAntigua and BarbudaArab WorldArgentinaArmeniaArubaAustraliaAustriaAzerbaijanBahamas, TheBahrainBangladeshBarbadosBelarusBelgiumBelizeBeninBermudaBhutanBoliviaBosnia and HerzegovinaBotswanaBrazilBrunei DarussalamBulgariaBurkina FasoBurundiCabo VerdeCambodiaCameroonCanadaCaribbean small statesCentral African RepublicCentral Europe and the BalticsChadChileChinaColombiaComorosCongo, Dem. Rep.Congo, Rep.Cote d'IvoireCroatiaCubaCyprusCzech RepublicDenmarkDominicaDominican RepublicEarly-demographic dividendEast Asia & PacificEast Asia & Pacific (excluding high income)East Asia & Pacific (IDA & IBRD countries)EcuadorEgypt, Arab Rep.El SalvadorEquatorial GuineaEritreaEstoniaEthiopiaEuro areaEurope & Central AsiaEurope & Central Asia (excluding high income)Europe & Central Asia (IDA & IBRD countries)European UnionFaroe IslandsFinlandFragile and conflict affected situationsFranceGabonGambia, TheGeorgiaGermanyGhanaGreeceGrenadaGuatemalaGuineaGuinea-BissauGuyanaHaitiHeavily indebted poor countries (HIPC)High incomeHondurasHong Kong SAR, ChinaHungaryIBRD onlyIcelandIDA & IBRD totalIDA blendIDA onlyIDA totalIndiaIndonesiaIran, Islamic Rep.IraqIrelandIsraelItalyJamaicaJapanJordanKazakhstanKenyaKorea, Rep.KosovoKuwaitKyrgyz RepublicLao PDRLate-demographic dividendLatin America & Caribbean Latin America & Caribbean (excluding high income)Latin America & the Caribbean (IDA & IBRD countries)LatviaLeast developed countries: UN classificationLebanonLiberiaLithuaniaLow & middle incomeLow incomeLower middle incomeLuxembourgMacao SAR, ChinaMacedonia, FYRMadagascarMalawiMalaysiaMaliMaltaMauritaniaMauritiusMexicoMiddle East & North AfricaMiddle East & North Africa (excluding high income)Middle East & North Africa (IDA & IBRD countries)Middle incomeMoldovaMongoliaMontenegroMoroccoMozambiqueNamibiaNepalNetherlandsNew ZealandNicaraguaNigerNigeriaNorth AmericaNorwayOECD membersOmanOther small statesPakistanPanamaParaguayPeruPhilippinesPolandPortugalPost-demographic dividendPre-demographic dividendPuerto RicoQatarRomaniaRussian FederationRwandaSaudi ArabiaSenegalSerbiaSeychellesSierra LeoneSingaporeSlovak RepublicSloveniaSmall statesSouth AfricaSouth AsiaSouth Asia (IDA & IBRD)South SudanSpainSri LankaSt. Kitts and NevisSt. LuciaSt. Vincent and the GrenadinesSub-Saharan Africa Sub-Saharan Africa (excluding high income)Sub-Saharan Africa (IDA & IBRD countries)SudanSurinameSwazilandSwedenSwitzerlandTajikistanTanzaniaThailandTimor-LesteTogoTongaTrinidad and TobagoTunisiaTurkeyTurkmenistanUgandaUkraineUnited Arab EmiratesUnited KingdomUnited StatesUpper middle incomeUruguayUzbekistanVanuatuVenezuela, RBVietnamWest Bank and GazaWorldYemen, Rep.ZambiaZimbabwe La ligne de temps
Cette échelle de temps montre un graphique de 1961 année à 2016 année Sri Lanka. Les données jusqu'à 1960 année ne sont pas présentés. Quantité d'observations actuelles selon dates: 56.
Source (désignation):
Les indicateurs du développement mondiale
Source (organisation):
World Bank national accounts data, and OECD National Accounts data files.
Catégories:
Economy & Growth
Dernière mise à jour
23 avr. 2017
Les indicateurs de changement de valeurs selon les années
Minimum:
667.653 mln.
1 janv. 1961
Maximum:
25.828 mds
1 janv. 2016
Pour la date d''observation
Valeur
Changement absolu
Le changement par rapport à la valeur précédente
1 janv. 1961
667.653 mln.
+667.653 mln.
0.0%
1 janv. 1962
814.522 mln.
+146.869 mln.
22.0%
1 janv. 1963
740.923 mln.
-73.599 mln.
-9.04%
1 janv. 1964
889.469 mln.
+148.546 mln.
20.05%
1 janv. 1965
805.014 mln.
-84.455 mln.
-9.5%
1 janv. 1966
733.486 mln.
-71.528 mln.
-8.89%
1 janv. 1967
857.738 mln.
+124.252 mln.
16.94%
1 janv. 1968
929.443 mln.
+71.705 mln.
8.36%
1 janv. 1969
1.133 mds
+203.275 mln.
21.87%
1 janv. 1970
1.293 mds
+160.315 mln.
14.15%
1 janv. 1971
1.58 mds
+286.627 mln.
22.17%
1 janv. 1972
1.481 mds
-98.647 mln.
-6.24%
1 janv. 1973
1.678 mds
+196.575 mln.
13.27%
1 janv. 1974
1.175 mds
-502.108 mln.
-29.93%
1 janv. 1975
2.144 mds
+968.274 mln.
82.37%
1 janv. 1976
1.819 mds
-325.189 mln.
-15.17%
1 janv. 1977
2.278 mds
+459.633 mln.
25.27%
1 janv. 1978
2.164 mds
-114.328 mln.
-5.02%
1 janv. 1979
3.116 mds
+952.105 mln.
44.0%
1 janv. 1980
4.178 mds
+1.062 mds
34.08%
1 janv. 1981
5.342 mds
+1.164 mds
27.86%
1 janv. 1982
4.493 mds
-849.101 mln.
-15.9%
1 janv. 1983
4.711 mds
+217.961 mln.
4.85%
1 janv. 1984
5.285 mds
+574.012 mln.
12.19%
1 janv. 1985
5.412 mds
+127.461 mln.
2.41%
1 janv. 1986
5.171 mds
-241.079 mln.
-4.45%
1 janv. 1987
5.641 mds
+470.255 mln.
9.09%
1 janv. 1988
5.613 mds
-28.263 mln.
-0.5%
1 janv. 1989
5.267 mds
-346.448 mln.
-6.17%
1 janv. 1990
4.902 mds
-364.571 mln.
-6.92%
1 janv. 1991
4.765 mds
-136.876 mln.
-2.79%
1 janv. 1992
5.176 mds
+410.966 mln.
8.62%
1 janv. 1993
5.275 mds
+98.801 mln.
1.91%
1 janv. 1994
5.834 mds
+558.903 mln.
10.6%
1 janv. 1995
6.377 mds
+543.391 mln.
9.31%
1 janv. 1996
6.325 mds
-52.25 mln.
-0.82%
1 janv. 1997
6.571 mds
+246.551 mln.
3.9%
1 janv. 1998
6.716 mds
+144.483 mln.
2.2%
1 janv. 1999
7.734 mds
+1.018 mds
15.16%
1 janv. 2000
8.225 mds
+490.37 mln.
6.34%
1 janv. 2001
9.04 mds
+814.898 mln.
9.91%
1 janv. 2002
7.46 mds
-1.579 mds
-17.47%
1 janv. 2003
8.367 mds
+906.151 mln.
12.15%
1 janv. 2004
9.37 mds
+1.003 mds
11.99%
1 janv. 2005
10.19 mds
+820.28 mln.
8.75%
1 janv. 2006
11.079 mds
+888.431 mln.
8.72%
1 janv. 2007
12.627 mds
+1.548 mds
13.98%
1 janv. 2008
13.489 mds
+861.808 mln.
6.83%
1 janv. 2009
13.892 mds
+402.847 mln.
2.99%
1 janv. 2010
14.303 mds
+410.884 mln.
2.96%
1 janv. 2011
17.218 mds
+2.915 mds
20.38%
1 janv. 2012
20.703 mds
+3.485 mds
20.24%
1 janv. 2013
25.195 mds
+4.492 mds
21.7%
1 janv. 2014
22.97 mds
-2.225 mds
-8.83%
1 janv. 2015
24.613 mds
+1.643 mds
7.15%
1 janv. 2016
25.828 mds
+1.214 mds
4.93%
Classement des pays selon les statistiques actuelles par années


Commentaires: