29
/fr/
fr
AIzaSyAYiBZKx7MnpbEhh9jyipgxe19OcubqV5w
April 1, 2024
127387
Equatorial Guinea
GNQ
true
2
1
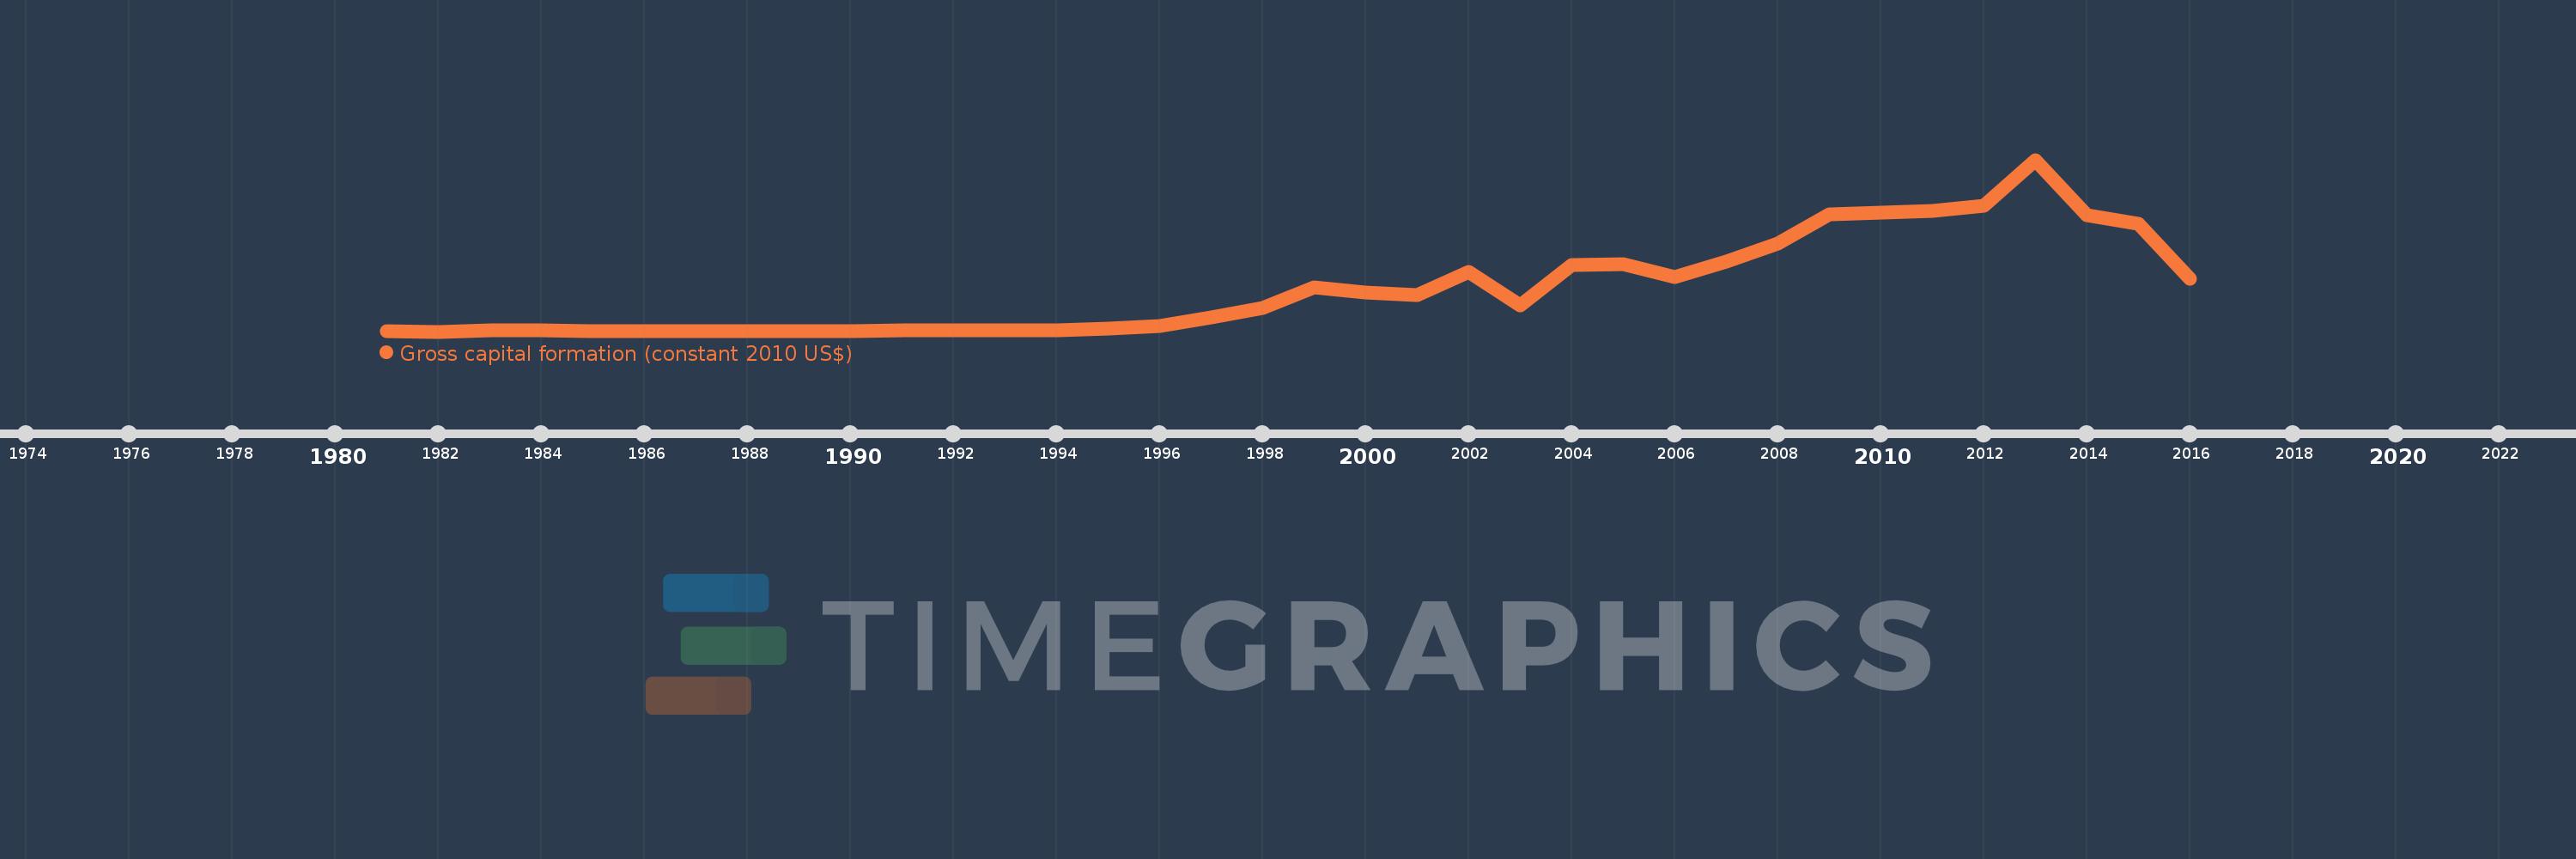
Gross capital formation (constant 2010 US$)
2016,2015,2014,2013,2012,2011,2010,2009,2008,2007,2006,2005,2004,2003,2002,2001,2000,1999,1998,1997,1996,1995,1994,1993,1992,1991,1990,1989,1988,1987,1986,1985,1984,1983,1982,1981
Cette statistique dans les autres pays:
AfghanistanAlbaniaAlgeriaAngolaAntigua and BarbudaArab WorldArgentinaArmeniaArubaAustraliaAustriaAzerbaijanBahamas, TheBahrainBangladeshBarbadosBelarusBelgiumBelizeBeninBermudaBhutanBoliviaBosnia and HerzegovinaBotswanaBrazilBrunei DarussalamBulgariaBurkina FasoBurundiCabo VerdeCambodiaCameroonCanadaCaribbean small statesCentral African RepublicCentral Europe and the BalticsChadChileChinaColombiaComorosCongo, Dem. Rep.Congo, Rep.Cote d'IvoireCroatiaCubaCyprusCzech RepublicDenmarkDominicaDominican RepublicEarly-demographic dividendEast Asia & PacificEast Asia & Pacific (excluding high income)East Asia & Pacific (IDA & IBRD countries)EcuadorEgypt, Arab Rep.El SalvadorEquatorial GuineaEritreaEstoniaEthiopiaEuro areaEurope & Central AsiaEurope & Central Asia (excluding high income)Europe & Central Asia (IDA & IBRD countries)European UnionFaroe IslandsFinlandFragile and conflict affected situationsFranceGabonGambia, TheGeorgiaGermanyGhanaGreeceGrenadaGuatemalaGuineaGuinea-BissauGuyanaHaitiHeavily indebted poor countries (HIPC)High incomeHondurasHong Kong SAR, ChinaHungaryIBRD onlyIcelandIDA & IBRD totalIDA blendIDA onlyIDA totalIndiaIndonesiaIran, Islamic Rep.IraqIrelandIsraelItalyJamaicaJapanJordanKazakhstanKenyaKorea, Rep.KosovoKuwaitKyrgyz RepublicLao PDRLate-demographic dividendLatin America & Caribbean Latin America & Caribbean (excluding high income)Latin America & the Caribbean (IDA & IBRD countries)LatviaLeast developed countries: UN classificationLebanonLiberiaLithuaniaLow & middle incomeLow incomeLower middle incomeLuxembourgMacao SAR, ChinaMacedonia, FYRMadagascarMalawiMalaysiaMaliMaltaMauritaniaMauritiusMexicoMiddle East & North AfricaMiddle East & North Africa (excluding high income)Middle East & North Africa (IDA & IBRD countries)Middle incomeMoldovaMongoliaMontenegroMoroccoMozambiqueNamibiaNepalNetherlandsNew ZealandNicaraguaNigerNigeriaNorth AmericaNorwayOECD membersOmanOther small statesPakistanPanamaParaguayPeruPhilippinesPolandPortugalPost-demographic dividendPre-demographic dividendPuerto RicoQatarRomaniaRussian FederationRwandaSaudi ArabiaSenegalSerbiaSeychellesSierra LeoneSingaporeSlovak RepublicSloveniaSmall statesSouth AfricaSouth AsiaSouth Asia (IDA & IBRD)South SudanSpainSri LankaSt. Kitts and NevisSt. LuciaSt. Vincent and the GrenadinesSub-Saharan Africa Sub-Saharan Africa (excluding high income)Sub-Saharan Africa (IDA & IBRD countries)SudanSurinameSwazilandSwedenSwitzerlandTajikistanTanzaniaThailandTimor-LesteTogoTongaTrinidad and TobagoTunisiaTurkeyTurkmenistanUgandaUkraineUnited Arab EmiratesUnited KingdomUnited StatesUpper middle incomeUruguayUzbekistanVanuatuVenezuela, RBVietnamWest Bank and GazaWorldYemen, Rep.ZambiaZimbabwe La ligne de temps
Cette échelle de temps montre un graphique de 1981 année à 2016 année Equatorial Guinea. Les données jusqu'à 1980 année ne sont pas présentés. Quantité d'observations actuelles selon dates: 36.
Source (désignation):
Les indicateurs du développement mondiale
Source (organisation):
World Bank national accounts data, and OECD National Accounts data files.
Catégories:
Economy & Growth
Dernière mise à jour
23 avr. 2017
Les indicateurs de changement de valeurs selon les années
Minimum:
48.59 mln.
1 janv. 1982
Maximum:
8.822 mds
1 janv. 2013
Pour la date d''observation
Valeur
Changement absolu
Le changement par rapport à la valeur précédente
1 janv. 1981
55.164 mln.
+55.164 mln.
0.0%
1 janv. 1982
48.59 mln.
-6.573 mln.
-11.92%
1 janv. 1983
126.316 mln.
+77.726 mln.
159.96%
1 janv. 1984
96.527 mln.
-29.789 mln.
-23.58%
1 janv. 1985
77.059 mln.
-19.468 mln.
-20.17%
1 janv. 1986
58.052 mln.
-19.008 mln.
-24.67%
1 janv. 1987
61.888 mln.
+3.837 mln.
6.61%
1 janv. 1988
79.755 mln.
+17.866 mln.
28.87%
1 janv. 1989
78.082 mln.
-1.673 mln.
-2.1%
1 janv. 1990
77.699 mln.
-383.028 milles
-0.49%
1 janv. 1991
110.409 mln.
+32.71 mln.
42.1%
1 janv. 1992
92.869 mln.
-17.54 mln.
-15.89%
1 janv. 1993
95.238 mln.
+2.369 mln.
2.55%
1 janv. 1994
119.277 mln.
+24.039 mln.
25.24%
1 janv. 1995
187.896 mln.
+68.619 mln.
57.53%
1 janv. 1996
322.213 mln.
+134.316 mln.
71.48%
1 janv. 1997
790.531 mln.
+468.318 mln.
145.34%
1 janv. 1998
1.255 mds
+464.836 mln.
58.8%
1 janv. 1999
2.295 mds
+1.039 mds
82.78%
1 janv. 2000
2.029 mds
-265.694 mln.
-11.58%
1 janv. 2001
1.925 mds
-103.439 mln.
-5.1%
1 janv. 2002
3.076 mds
+1.15 mds
59.73%
1 janv. 2003
1.372 mds
-1.704 mds
-55.39%
1 janv. 2004
3.465 mds
+2.093 mds
152.57%
1 janv. 2005
3.483 mds
+17.433 mln.
0.5%
1 janv. 2006
2.844 mds
-639.155 mln.
-18.35%
1 janv. 2007
3.603 mds
+759.349 mln.
26.7%
1 janv. 2008
4.56 mds
+957.032 mln.
26.56%
1 janv. 2009
6.027 mds
+1.467 mds
32.18%
1 janv. 2010
6.132 mds
+104.922 mln.
1.74%
1 janv. 2011
6.203 mds
+70.307 mln.
1.15%
1 janv. 2012
6.468 mds
+265.532 mln.
4.28%
1 janv. 2013
8.822 mds
+2.354 mds
36.39%
1 janv. 2014
6.006 mds
-2.816 mds
-31.92%
1 janv. 2015
5.534 mds
-472.535 mln.
-7.87%
1 janv. 2016
2.732 mds
-2.802 mds
-50.63%
Classement des pays selon les statistiques actuelles par années


Commentaires: