29
/fr/
fr
AIzaSyAYiBZKx7MnpbEhh9jyipgxe19OcubqV5w
April 1, 2024
144416
Guatemala
GTM
true
2
1
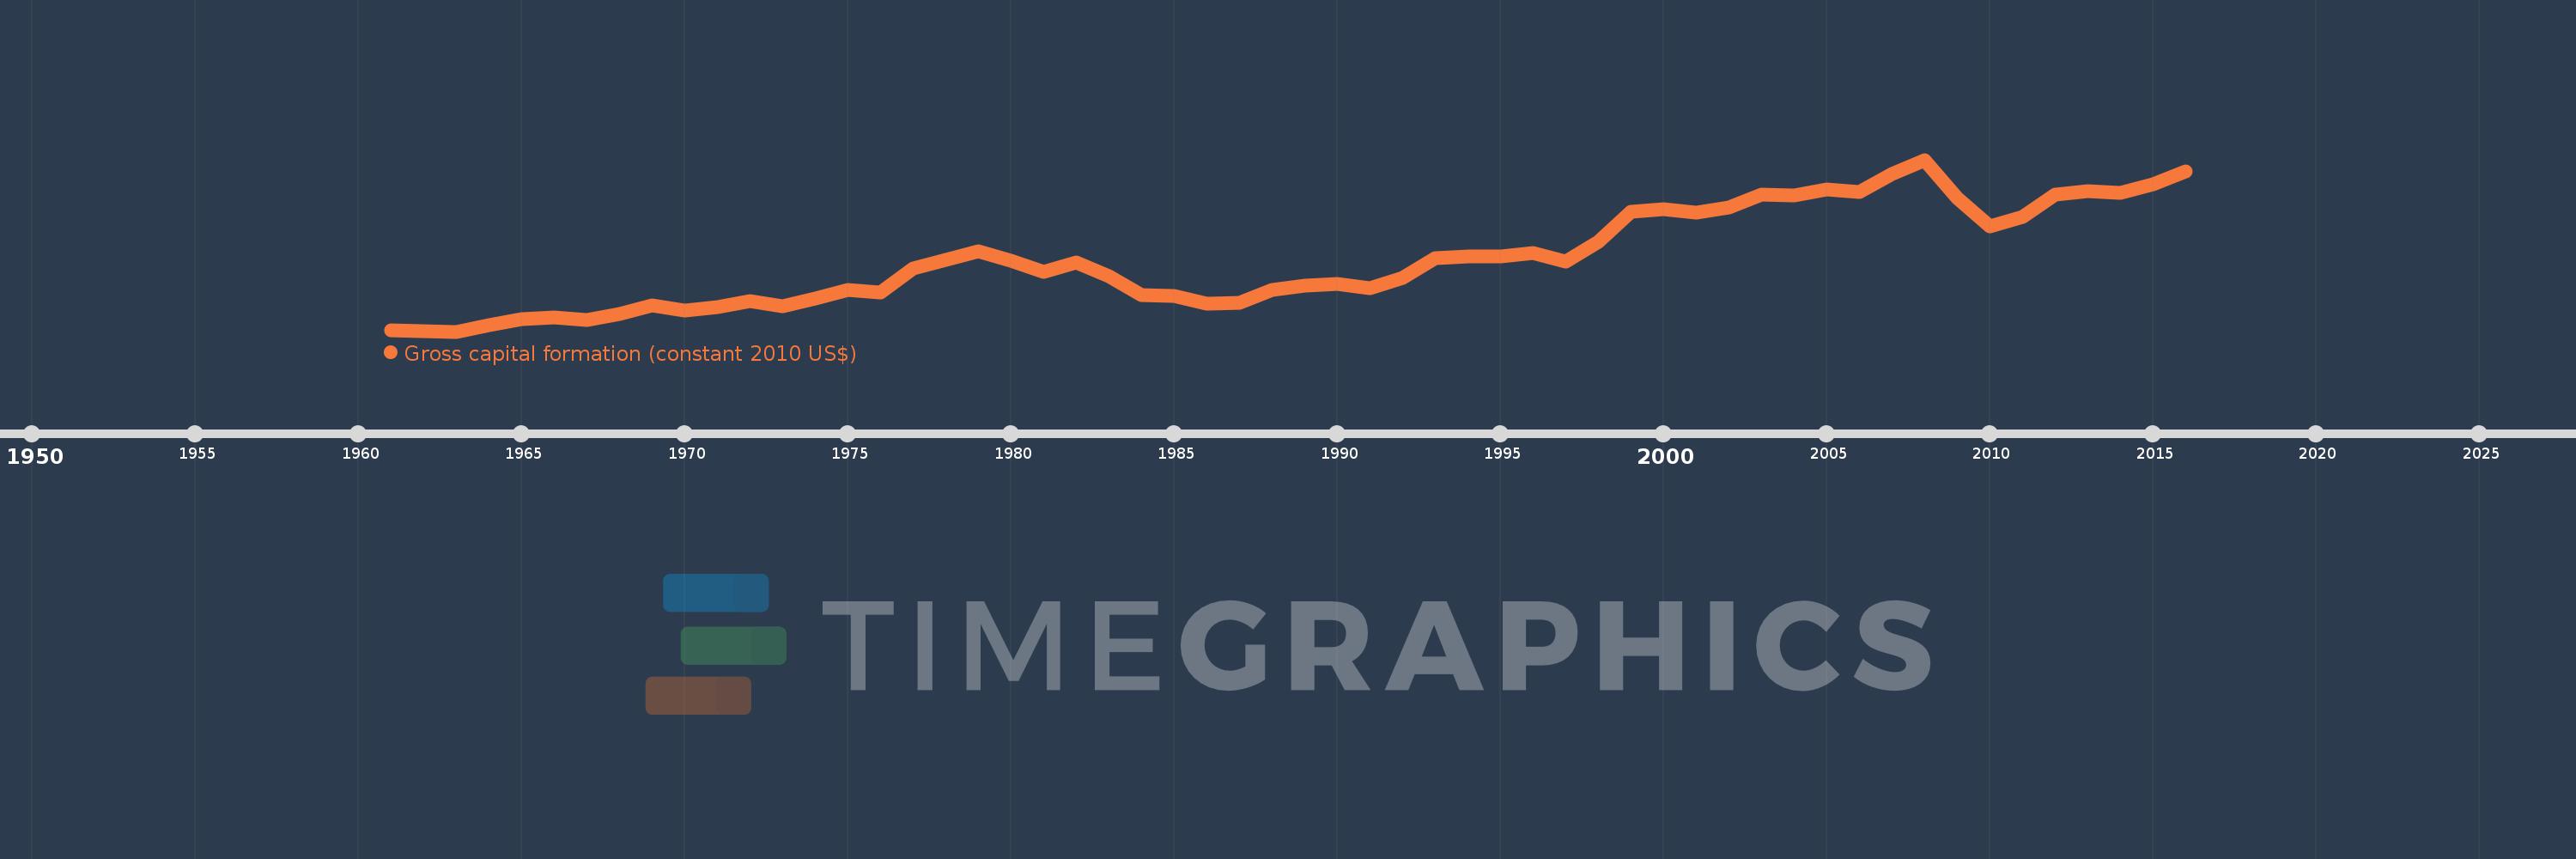
Gross capital formation (constant 2010 US$)
2016,2015,2014,2013,2012,2011,2010,2009,2008,2007,2006,2005,2004,2003,2002,2001,2000,1999,1998,1997,1996,1995,1994,1993,1992,1991,1990,1989,1988,1987,1986,1985,1984,1983,1982,1981,1980,1979,1978,1977,1976,1975,1974,1973,1972,1971,1970,1969,1968,1967,1966,1965,1964,1963,1962,1961
Cette statistique dans les autres pays:
AfghanistanAlbaniaAlgeriaAngolaAntigua and BarbudaArab WorldArgentinaArmeniaArubaAustraliaAustriaAzerbaijanBahamas, TheBahrainBangladeshBarbadosBelarusBelgiumBelizeBeninBermudaBhutanBoliviaBosnia and HerzegovinaBotswanaBrazilBrunei DarussalamBulgariaBurkina FasoBurundiCabo VerdeCambodiaCameroonCanadaCaribbean small statesCentral African RepublicCentral Europe and the BalticsChadChileChinaColombiaComorosCongo, Dem. Rep.Congo, Rep.Cote d'IvoireCroatiaCubaCyprusCzech RepublicDenmarkDominicaDominican RepublicEarly-demographic dividendEast Asia & PacificEast Asia & Pacific (excluding high income)East Asia & Pacific (IDA & IBRD countries)EcuadorEgypt, Arab Rep.El SalvadorEquatorial GuineaEritreaEstoniaEthiopiaEuro areaEurope & Central AsiaEurope & Central Asia (excluding high income)Europe & Central Asia (IDA & IBRD countries)European UnionFaroe IslandsFinlandFragile and conflict affected situationsFranceGabonGambia, TheGeorgiaGermanyGhanaGreeceGrenadaGuatemalaGuineaGuinea-BissauGuyanaHaitiHeavily indebted poor countries (HIPC)High incomeHondurasHong Kong SAR, ChinaHungaryIBRD onlyIcelandIDA & IBRD totalIDA blendIDA onlyIDA totalIndiaIndonesiaIran, Islamic Rep.IraqIrelandIsraelItalyJamaicaJapanJordanKazakhstanKenyaKorea, Rep.KosovoKuwaitKyrgyz RepublicLao PDRLate-demographic dividendLatin America & Caribbean Latin America & Caribbean (excluding high income)Latin America & the Caribbean (IDA & IBRD countries)LatviaLeast developed countries: UN classificationLebanonLiberiaLithuaniaLow & middle incomeLow incomeLower middle incomeLuxembourgMacao SAR, ChinaMacedonia, FYRMadagascarMalawiMalaysiaMaliMaltaMauritaniaMauritiusMexicoMiddle East & North AfricaMiddle East & North Africa (excluding high income)Middle East & North Africa (IDA & IBRD countries)Middle incomeMoldovaMongoliaMontenegroMoroccoMozambiqueNamibiaNepalNetherlandsNew ZealandNicaraguaNigerNigeriaNorth AmericaNorwayOECD membersOmanOther small statesPakistanPanamaParaguayPeruPhilippinesPolandPortugalPost-demographic dividendPre-demographic dividendPuerto RicoQatarRomaniaRussian FederationRwandaSaudi ArabiaSenegalSerbiaSeychellesSierra LeoneSingaporeSlovak RepublicSloveniaSmall statesSouth AfricaSouth AsiaSouth Asia (IDA & IBRD)South SudanSpainSri LankaSt. Kitts and NevisSt. LuciaSt. Vincent and the GrenadinesSub-Saharan Africa Sub-Saharan Africa (excluding high income)Sub-Saharan Africa (IDA & IBRD countries)SudanSurinameSwazilandSwedenSwitzerlandTajikistanTanzaniaThailandTimor-LesteTogoTongaTrinidad and TobagoTunisiaTurkeyTurkmenistanUgandaUkraineUnited Arab EmiratesUnited KingdomUnited StatesUpper middle incomeUruguayUzbekistanVanuatuVenezuela, RBVietnamWest Bank and GazaWorldYemen, Rep.ZambiaZimbabwe La ligne de temps
Cette échelle de temps montre un graphique de 1961 année à 2016 année Guatemala. Les données jusqu'à 1960 année ne sont pas présentés. Quantité d'observations actuelles selon dates: 56.
Source (désignation):
Les indicateurs du développement mondiale
Source (organisation):
World Bank national accounts data, and OECD National Accounts data files.
Catégories:
Economy & Growth
Dernière mise à jour
23 avr. 2017
Les indicateurs de changement de valeurs selon les années
Minimum:
1.006 mds
1 janv. 1963
Maximum:
8.126 mds
1 janv. 2008
Pour la date d''observation
Valeur
Changement absolu
Le changement par rapport à la valeur précédente
1 janv. 1961
1.049 mds
+1.049 mds
0.0%
1 janv. 1962
1.021 mds
-28.498 mln.
-2.72%
1 janv. 1963
1.006 mds
-14.174 mln.
-1.39%
1 janv. 1964
1.263 mds
+256.684 mln.
25.51%
1 janv. 1965
1.533 mds
+269.84 mln.
21.36%
1 janv. 1966
1.599 mds
+65.786 mln.
4.29%
1 janv. 1967
1.5 mds
-98.432 mln.
-6.16%
1 janv. 1968
1.735 mds
+234.632 mln.
15.64%
1 janv. 1969
2.094 mds
+359.544 mln.
20.72%
1 janv. 1970
1.865 mds
-229.272 mln.
-10.95%
1 janv. 1971
2.016 mds
+151.183 mln.
8.11%
1 janv. 1972
2.257 mds
+240.266 mln.
11.92%
1 janv. 1973
2.073 mds
-183.124 mln.
-8.12%
1 janv. 1974
2.376 mds
+302.731 mln.
14.6%
1 janv. 1975
2.744 mds
+367.405 mln.
15.46%
1 janv. 1976
2.619 mds
-124.927 mln.
-4.55%
1 janv. 1977
3.62 mds
+1.001 mds
38.22%
1 janv. 1978
3.991 mds
+371.056 mln.
10.25%
1 janv. 1979
4.342 mds
+351.646 mln.
8.81%
1 janv. 1980
3.941 mds
-400.939 mln.
-9.23%
1 janv. 1981
3.469 mds
-472.825 mln.
-12.0%
1 janv. 1982
3.859 mds
+390.275 mln.
11.25%
1 janv. 1983
3.285 mds
-573.763 mln.
-14.87%
1 janv. 1984
2.529 mds
-756.046 mln.
-23.01%
1 janv. 1985
2.49 mds
-38.891 mln.
-1.54%
1 janv. 1986
2.163 mds
-326.842 mln.
-13.13%
1 janv. 1987
2.209 mds
+45.803 mln.
2.12%
1 janv. 1988
2.743 mds
+534.044 mln.
24.17%
1 janv. 1989
2.897 mds
+153.589 mln.
5.6%
1 janv. 1990
2.998 mds
+101.13 mln.
3.49%
1 janv. 1991
2.816 mds
-182.332 mln.
-6.08%
1 janv. 1992
3.221 mds
+405.83 mln.
14.41%
1 janv. 1993
4.038 mds
+816.779 mln.
25.36%
1 janv. 1994
4.134 mds
+95.509 mln.
2.37%
1 janv. 1995
4.111 mds
-22.206 mln.
-0.54%
1 janv. 1996
4.261 mds
+149.23 mln.
3.63%
1 janv. 1997
3.908 mds
-352.872 mln.
-8.28%
1 janv. 1998
4.744 mds
+835.862 mln.
21.39%
1 janv. 1999
5.97 mds
+1.226 mds
25.85%
1 janv. 2000
6.092 mds
+122.284 mln.
2.05%
1 janv. 2001
5.923 mds
-169.583 mln.
-2.78%
1 janv. 2002
6.165 mds
+242.608 mln.
4.1%
1 janv. 2003
6.694 mds
+529.236 mln.
8.58%
1 janv. 2004
6.637 mds
-57.116 mln.
-0.85%
1 janv. 2005
6.881 mds
+243.773 mln.
3.67%
1 janv. 2006
6.789 mds
-91.815 mln.
-1.33%
1 janv. 2007
7.538 mds
+748.836 mln.
11.03%
1 janv. 2008
8.126 mds
+588.034 mln.
7.8%
1 janv. 2009
6.539 mds
-1.587 mds
-19.53%
1 janv. 2010
5.367 mds
-1.171 mds
-17.91%
1 janv. 2011
5.762 mds
+394.087 mln.
7.34%
1 janv. 2012
6.696 mds
+934.71 mln.
16.22%
1 janv. 2013
6.829 mds
+132.561 mln.
1.98%
1 janv. 2014
6.761 mds
-68.164 mln.
-1.0%
1 janv. 2015
7.113 mds
+352.224 mln.
5.21%
1 janv. 2016
7.648 mds
+535.003 mln.
7.52%
Classement des pays selon les statistiques actuelles par années


Commentaires: