29
/fr/
fr
AIzaSyAYiBZKx7MnpbEhh9jyipgxe19OcubqV5w
April 1, 2024
93228
Bulgaria
BGR
true
2
1
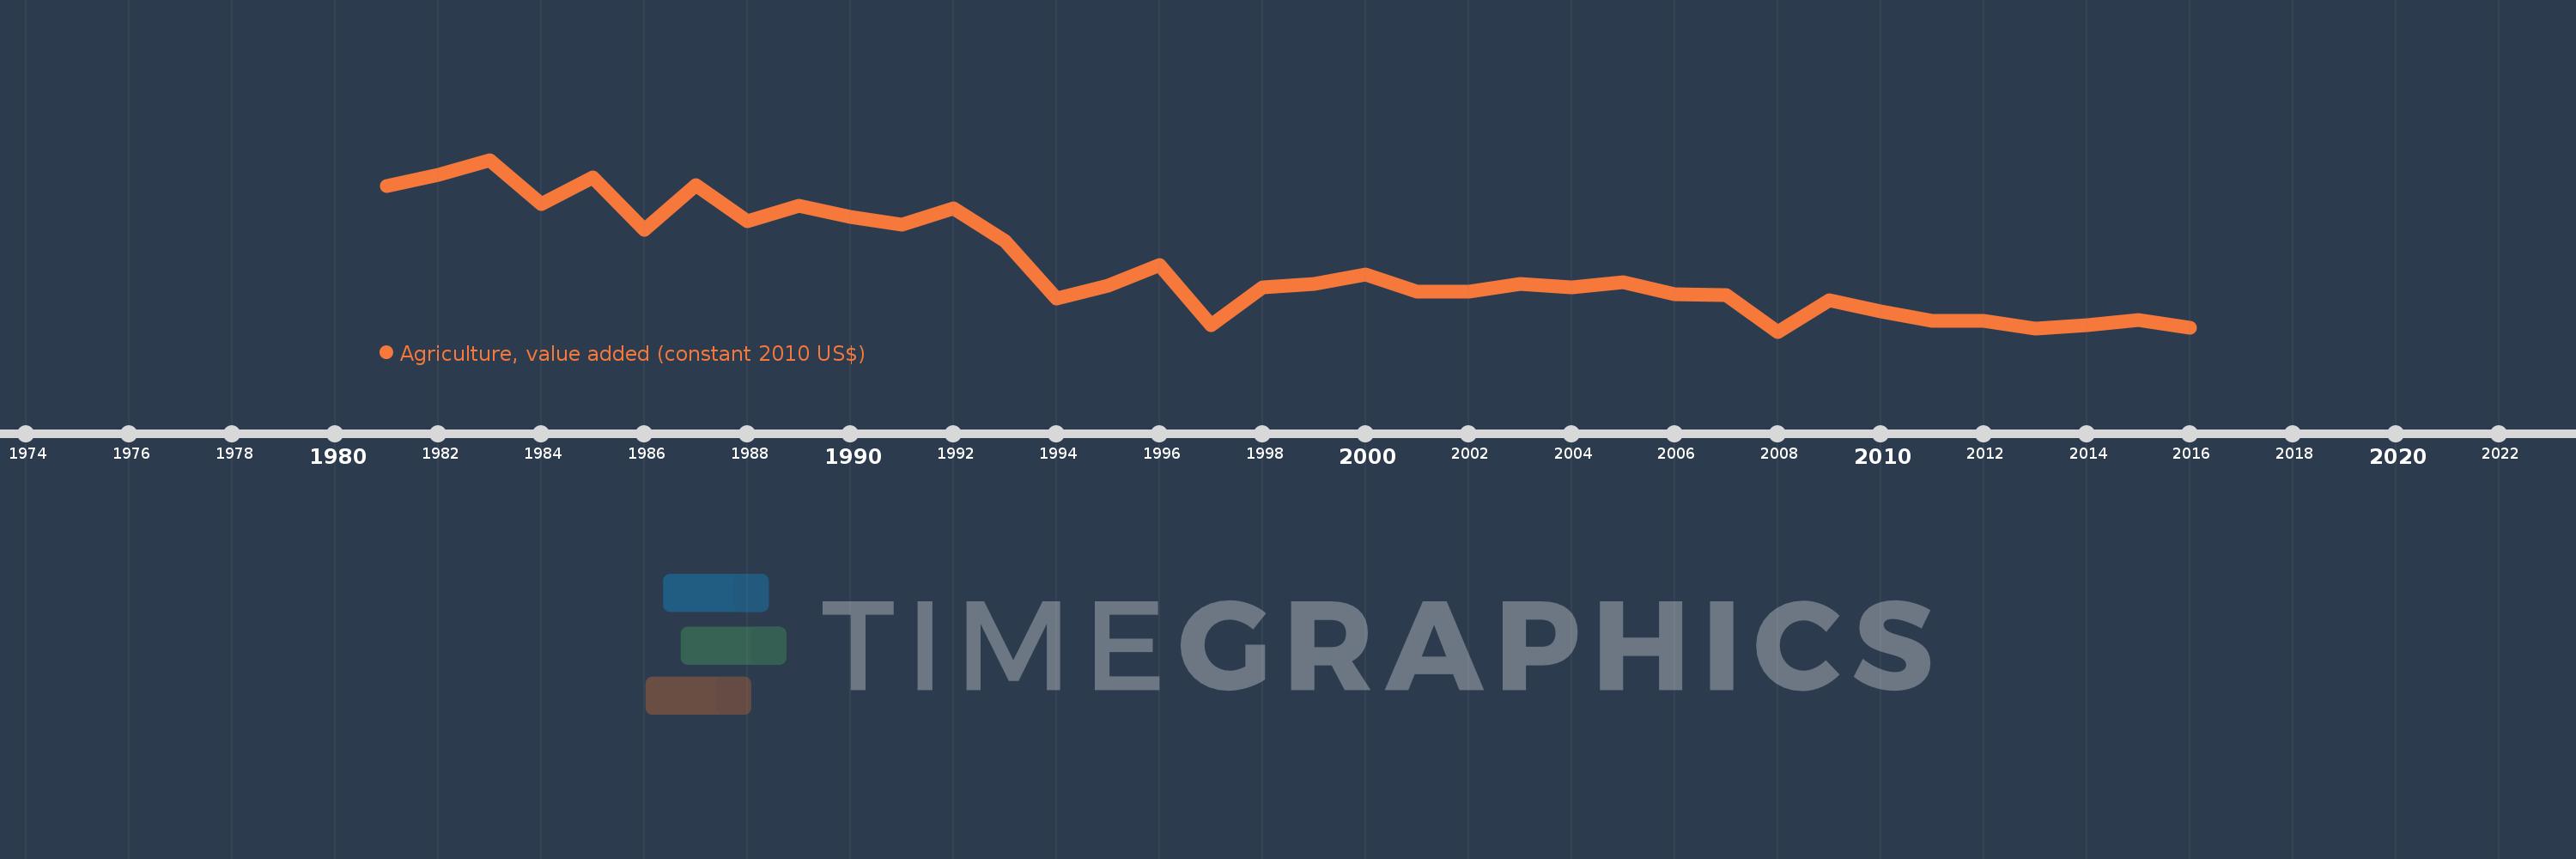
Agriculture, value added (constant 2010 US$)
2016,2015,2014,2013,2012,2011,2010,2009,2008,2007,2006,2005,2004,2003,2002,2001,2000,1999,1998,1997,1996,1995,1994,1993,1992,1991,1990,1989,1988,1987,1986,1985,1984,1983,1982,1981
Cette statistique dans les autres pays:
AfghanistanAlbaniaAlgeriaAndorraAntigua and BarbudaArab WorldArgentinaArmeniaArubaAustraliaAustriaAzerbaijanBahamas, TheBahrainBangladeshBarbadosBelarusBelgiumBelizeBeninBermudaBhutanBoliviaBosnia and HerzegovinaBotswanaBrazilBrunei DarussalamBulgariaBurkina FasoBurundiCabo VerdeCambodiaCameroonCanadaCaribbean small statesCentral African RepublicCentral Europe and the BalticsChadChileChinaColombiaComorosCongo, Dem. Rep.Congo, Rep.Costa RicaCote d'IvoireCroatiaCubaCyprusCzech RepublicDenmarkDominicaDominican RepublicEarly-demographic dividendEast Asia & PacificEast Asia & Pacific (excluding high income)East Asia & Pacific (IDA & IBRD countries)EcuadorEgypt, Arab Rep.El SalvadorEquatorial GuineaEstoniaEthiopiaEuro areaEurope & Central AsiaEurope & Central Asia (excluding high income)Europe & Central Asia (IDA & IBRD countries)European UnionFijiFinlandFragile and conflict affected situationsFranceGabonGambia, TheGeorgiaGermanyGhanaGreeceGrenadaGuatemalaGuineaGuinea-BissauGuyanaHeavily indebted poor countries (HIPC)High incomeHondurasHong Kong SAR, ChinaHungaryIBRD onlyIcelandIDA & IBRD totalIDA blendIDA onlyIDA totalIndiaIndonesiaIran, Islamic Rep.IraqIrelandItalyJamaicaJapanJordanKazakhstanKenyaKiribatiKorea, Rep.KosovoKuwaitKyrgyz RepublicLao PDRLate-demographic dividendLatin America & Caribbean Latin America & Caribbean (excluding high income)Latin America & the Caribbean (IDA & IBRD countries)LatviaLeast developed countries: UN classificationLebanonLesothoLiberiaLithuaniaLow & middle incomeLow incomeLower middle incomeLuxembourgMacao SAR, ChinaMacedonia, FYRMadagascarMalawiMalaysiaMaldivesMaliMaltaMarshall IslandsMauritaniaMauritiusMexicoMicronesia, Fed. Sts.Middle East & North AfricaMiddle East & North Africa (excluding high income)Middle East & North Africa (IDA & IBRD countries)Middle incomeMoldovaMongoliaMontenegroMoroccoMozambiqueMyanmarNamibiaNepalNetherlandsNew ZealandNicaraguaNigerNigeriaNorth AmericaNorwayOECD membersOmanOther small statesPakistanPalauPanamaParaguayPeruPhilippinesPolandPortugalPost-demographic dividendPre-demographic dividendPuerto RicoQatarRomaniaRussian FederationRwandaSamoaSao Tome and PrincipeSaudi ArabiaSenegalSerbiaSeychellesSierra LeoneSingaporeSlovak RepublicSloveniaSmall statesSouth AfricaSouth AsiaSouth Asia (IDA & IBRD)SpainSri LankaSt. Kitts and NevisSt. LuciaSt. Vincent and the GrenadinesSub-Saharan Africa Sub-Saharan Africa (excluding high income)Sub-Saharan Africa (IDA & IBRD countries)SudanSurinameSwazilandSwedenSwitzerlandTajikistanTanzaniaThailandTimor-LesteTogoTongaTrinidad and TobagoTunisiaTurkeyTurkmenistanTuvaluUgandaUkraineUnited Arab EmiratesUnited KingdomUnited StatesUpper middle incomeUruguayUzbekistanVanuatuVenezuela, RBVietnamWest Bank and GazaWorldYemen, Rep.ZambiaZimbabwe La ligne de temps
Cette échelle de temps montre un graphique de 1981 année à 2016 année Bulgaria. Les données jusqu'à 1980 année ne sont pas présentés. Quantité d'observations actuelles selon dates: 36.
Source (désignation):
Les indicateurs du développement mondiale
Source (organisation):
World Bank national accounts data, and OECD National Accounts data files.
Catégories:
Economy & Growth
Dernière mise à jour
23 avr. 2017
Les indicateurs de changement de valeurs selon les années
Minimum:
1.905 mds
1 janv. 2008
Maximum:
5.209 mds
1 janv. 1983
Pour la date d''observation
Valeur
Changement absolu
Le changement par rapport à la valeur précédente
1 janv. 1981
4.713 mds
+4.713 mds
0.0%
1 janv. 1982
4.924 mds
+210.697 mln.
4.47%
1 janv. 1983
5.209 mds
+285.228 mln.
5.79%
1 janv. 1984
4.358 mds
-851.007 mln.
-16.34%
1 janv. 1985
4.867 mds
+509.068 mln.
11.68%
1 janv. 1986
3.864 mds
-1.004 mds
-20.62%
1 janv. 1987
4.716 mds
+851.794 mln.
22.05%
1 janv. 1988
4.025 mds
-690.129 mln.
-14.64%
1 janv. 1989
4.333 mds
+307.774 mln.
7.65%
1 janv. 1990
4.118 mds
-215.57 mln.
-4.97%
1 janv. 1991
3.965 mds
-152.312 mln.
-3.7%
1 janv. 1992
4.271 mds
+305.215 mln.
7.7%
1 janv. 1993
3.64 mds
-630.219 mln.
-14.76%
1 janv. 1994
2.54 mds
-1.1 mds
-30.22%
1 janv. 1995
2.781 mds
+240.578 mln.
9.47%
1 janv. 1996
3.183 mds
+401.849 mln.
14.45%
1 janv. 1997
2.024 mds
-1.158 mds
-36.4%
1 janv. 1998
2.749 mds
+724.516 mln.
35.79%
1 janv. 1999
2.817 mds
+67.957 mln.
2.47%
1 janv. 2000
3.004 mds
+187.221 mln.
6.65%
1 janv. 2001
2.666 mds
-337.891 mln.
-11.25%
1 janv. 2002
2.679 mds
+12.86 mln.
0.48%
1 janv. 2003
2.818 mds
+139.366 mln.
5.2%
1 janv. 2004
2.762 mds
-56.586 mln.
-2.01%
1 janv. 2005
2.862 mds
+99.905 mln.
3.62%
1 janv. 2006
2.618 mds
-243.062 mln.
-8.49%
1 janv. 2007
2.605 mds
-12.996 mln.
-0.5%
1 janv. 2008
1.905 mds
-700.69 mln.
-26.89%
1 janv. 2009
2.514 mds
+609.449 mln.
32.0%
1 janv. 2010
2.287 mds
-227.224 mln.
-9.04%
1 janv. 2011
2.105 mds
-182.249 mln.
-7.97%
1 janv. 2012
2.118 mds
+13.036 mln.
0.62%
1 janv. 2013
1.961 mds
-157.152 mln.
-7.42%
1 janv. 2014
2.025 mds
+64.584 mln.
3.29%
1 janv. 2015
2.123 mds
+97.675 mln.
4.82%
1 janv. 2016
1.978 mds
-144.645 mln.
-6.81%
Classement des pays selon les statistiques actuelles par années


Commentaires: