29
/fr/
fr
AIzaSyAYiBZKx7MnpbEhh9jyipgxe19OcubqV5w
April 1, 2024
24672
Caribbean small states
CSS
false
2
1
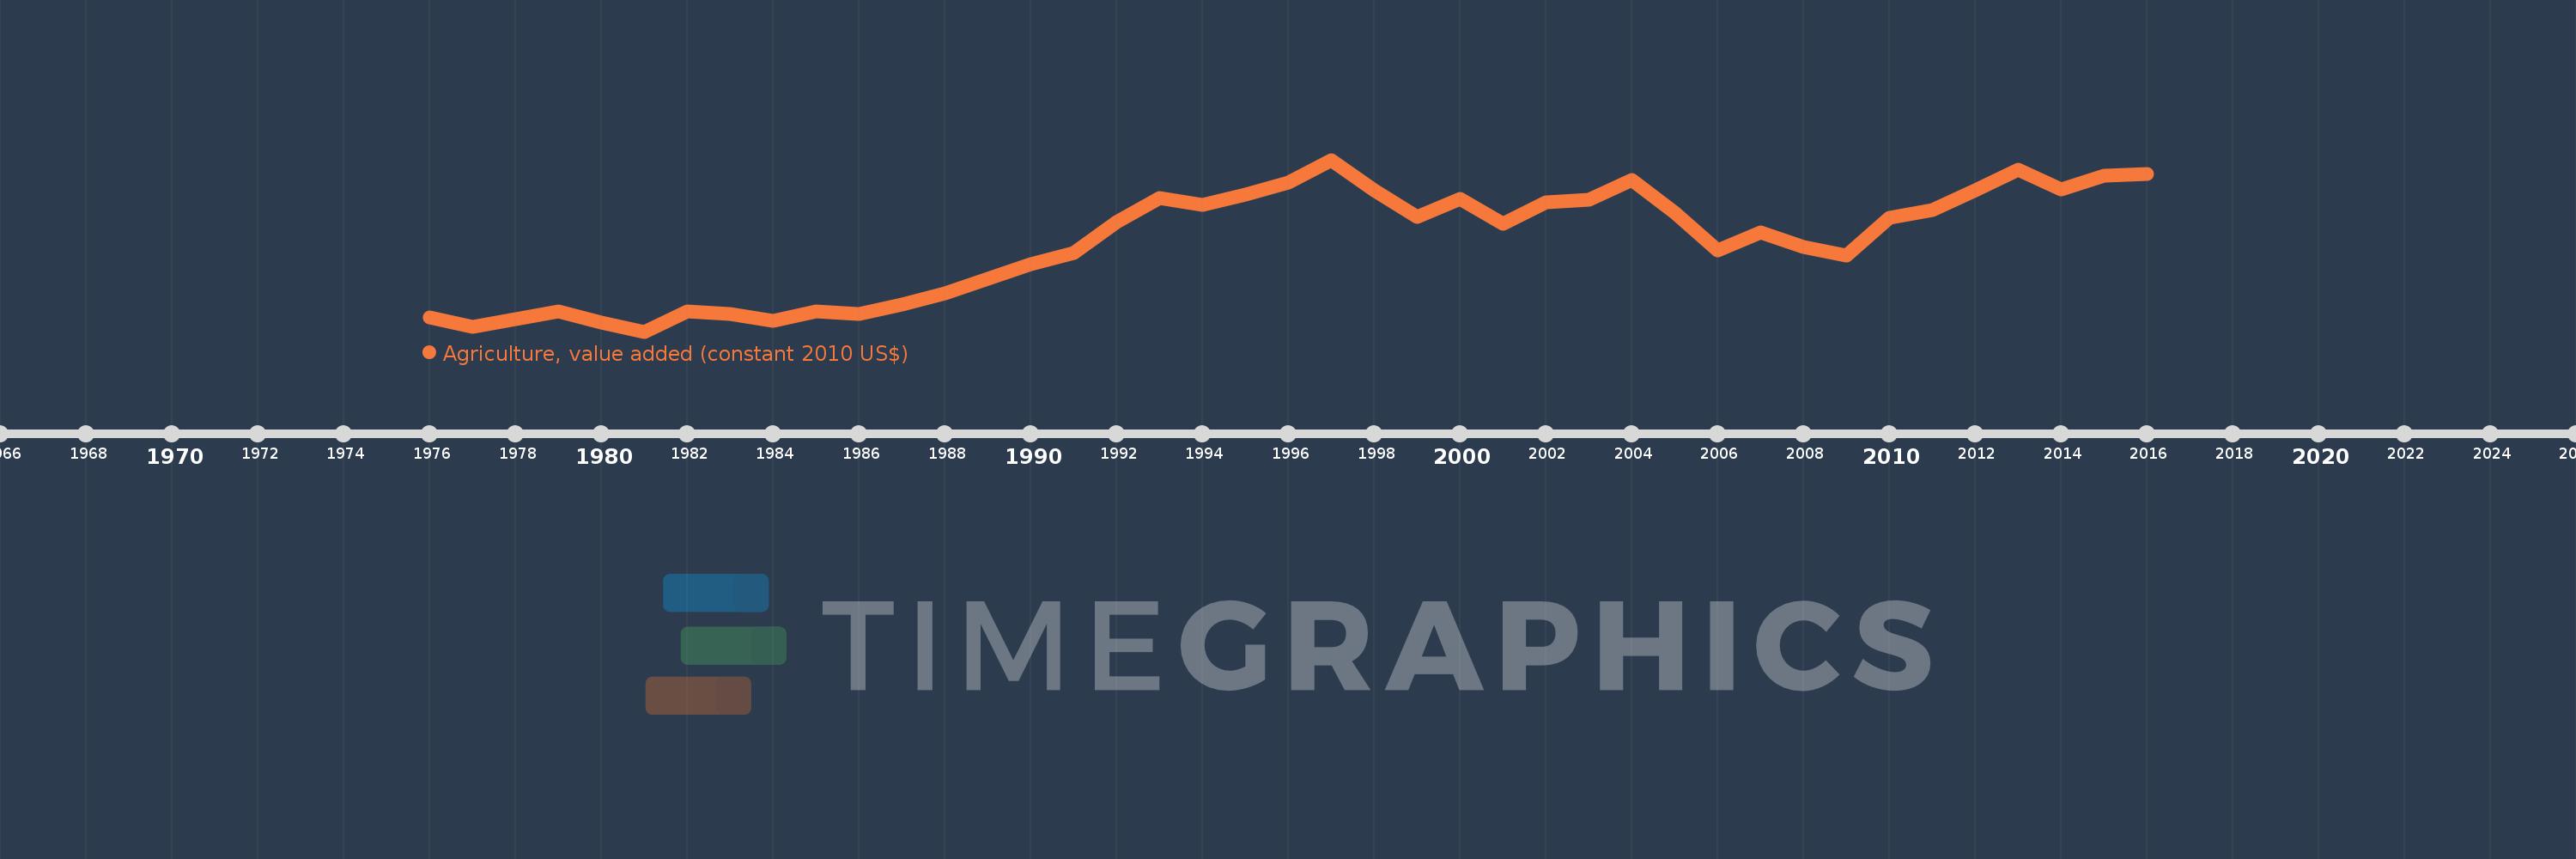
Agriculture, value added (constant 2010 US$)
2016,2015,2014,2013,2012,2011,2010,2009,2008,2007,2006,2005,2004,2003,2002,2001,2000,1999,1998,1997,1996,1995,1994,1993,1992,1991,1990,1989,1988,1987,1986,1985,1984,1983,1982,1981,1980,1979,1978,1977,1976
Cette statistique dans les autres pays:
AfghanistanAlbaniaAlgeriaAndorraAntigua and BarbudaArab WorldArgentinaArmeniaArubaAustraliaAustriaAzerbaijanBahamas, TheBahrainBangladeshBarbadosBelarusBelgiumBelizeBeninBermudaBhutanBoliviaBosnia and HerzegovinaBotswanaBrazilBrunei DarussalamBulgariaBurkina FasoBurundiCabo VerdeCambodiaCameroonCanadaCaribbean small statesCentral African RepublicCentral Europe and the BalticsChadChileChinaColombiaComorosCongo, Dem. Rep.Congo, Rep.Costa RicaCote d'IvoireCroatiaCubaCyprusCzech RepublicDenmarkDominicaDominican RepublicEarly-demographic dividendEast Asia & PacificEast Asia & Pacific (excluding high income)East Asia & Pacific (IDA & IBRD countries)EcuadorEgypt, Arab Rep.El SalvadorEquatorial GuineaEstoniaEthiopiaEuro areaEurope & Central AsiaEurope & Central Asia (excluding high income)Europe & Central Asia (IDA & IBRD countries)European UnionFijiFinlandFragile and conflict affected situationsFranceGabonGambia, TheGeorgiaGermanyGhanaGreeceGrenadaGuatemalaGuineaGuinea-BissauGuyanaHeavily indebted poor countries (HIPC)High incomeHondurasHong Kong SAR, ChinaHungaryIBRD onlyIcelandIDA & IBRD totalIDA blendIDA onlyIDA totalIndiaIndonesiaIran, Islamic Rep.IraqIrelandItalyJamaicaJapanJordanKazakhstanKenyaKiribatiKorea, Rep.KosovoKuwaitKyrgyz RepublicLao PDRLate-demographic dividendLatin America & Caribbean Latin America & Caribbean (excluding high income)Latin America & the Caribbean (IDA & IBRD countries)LatviaLeast developed countries: UN classificationLebanonLesothoLiberiaLithuaniaLow & middle incomeLow incomeLower middle incomeLuxembourgMacao SAR, ChinaMacedonia, FYRMadagascarMalawiMalaysiaMaldivesMaliMaltaMarshall IslandsMauritaniaMauritiusMexicoMicronesia, Fed. Sts.Middle East & North AfricaMiddle East & North Africa (excluding high income)Middle East & North Africa (IDA & IBRD countries)Middle incomeMoldovaMongoliaMontenegroMoroccoMozambiqueMyanmarNamibiaNepalNetherlandsNew ZealandNicaraguaNigerNigeriaNorth AmericaNorwayOECD membersOmanOther small statesPakistanPalauPanamaParaguayPeruPhilippinesPolandPortugalPost-demographic dividendPre-demographic dividendPuerto RicoQatarRomaniaRussian FederationRwandaSamoaSao Tome and PrincipeSaudi ArabiaSenegalSerbiaSeychellesSierra LeoneSingaporeSlovak RepublicSloveniaSmall statesSouth AfricaSouth AsiaSouth Asia (IDA & IBRD)SpainSri LankaSt. Kitts and NevisSt. LuciaSt. Vincent and the GrenadinesSub-Saharan Africa Sub-Saharan Africa (excluding high income)Sub-Saharan Africa (IDA & IBRD countries)SudanSurinameSwazilandSwedenSwitzerlandTajikistanTanzaniaThailandTimor-LesteTogoTongaTrinidad and TobagoTunisiaTurkeyTurkmenistanTuvaluUgandaUkraineUnited Arab EmiratesUnited KingdomUnited StatesUpper middle incomeUruguayUzbekistanVanuatuVenezuela, RBVietnamWest Bank and GazaWorldYemen, Rep.ZambiaZimbabwe La ligne de temps
Cette échelle de temps montre un graphique de 1976 année à 2016 année Caribbean small states. Les données jusqu'à 1975 année ne sont pas présentés. Quantité d'observations actuelles selon dates: 41.
Source (désignation):
Les indicateurs du développement mondiale
Source (organisation):
World Bank national accounts data, and OECD National Accounts data files.
Catégories:
Economy & Growth
Dernière mise à jour
23 avr. 2017
Les indicateurs de changement de valeurs selon les années
Minimum:
1.644 mds
1 janv. 1981
Maximum:
2.397 mds
1 janv. 1997
Pour la date d''observation
Valeur
Changement absolu
Le changement par rapport à la valeur précédente
1 janv. 1976
1.707 mds
+1.707 mds
0.0%
1 janv. 1977
1.663 mds
-43.479 mln.
-2.55%
1 janv. 1978
1.697 mds
+33.69 mln.
2.03%
1 janv. 1979
1.732 mds
+35.052 mln.
2.07%
1 janv. 1980
1.684 mds
-48.494 mln.
-2.8%
1 janv. 1981
1.644 mds
-39.827 mln.
-2.37%
1 janv. 1982
1.731 mds
+87.424 mln.
5.32%
1 janv. 1983
1.721 mds
-9.998 mln.
-0.58%
1 janv. 1984
1.691 mds
-29.902 mln.
-1.74%
1 janv. 1985
1.733 mds
+42.121 mln.
2.49%
1 janv. 1986
1.721 mds
-12.52 mln.
-0.72%
1 janv. 1987
1.762 mds
+41.459 mln.
2.41%
1 janv. 1988
1.813 mds
+50.799 mln.
2.88%
1 janv. 1989
1.874 mds
+60.47 mln.
3.34%
1 janv. 1990
1.941 mds
+66.923 mln.
3.57%
1 janv. 1991
1.99 mds
+49.83 mln.
2.57%
1 janv. 1992
2.125 mds
+134.244 mln.
6.74%
1 janv. 1993
2.229 mds
+104.889 mln.
4.94%
1 janv. 1994
2.201 mds
-28.727 mln.
-1.29%
1 janv. 1995
2.244 mds
+43.565 mln.
1.98%
1 janv. 1996
2.296 mds
+51.949 mln.
2.31%
1 janv. 1997
2.397 mds
+100.978 mln.
4.4%
1 janv. 1998
2.263 mds
-133.883 mln.
-5.58%
1 janv. 1999
2.146 mds
-117.79 mln.
-5.2%
1 janv. 2000
2.226 mds
+80.429 mln.
3.75%
1 janv. 2001
2.118 mds
-108.269 mln.
-4.86%
1 janv. 2002
2.209 mds
+91.646 mln.
4.33%
1 janv. 2003
2.223 mds
+13.813 mln.
0.63%
1 janv. 2004
2.308 mds
+84.358 mln.
3.79%
1 janv. 2005
2.166 mds
-141.672 mln.
-6.14%
1 janv. 2006
2.0 mds
-165.949 mln.
-7.66%
1 janv. 2007
2.08 mds
+79.868 mln.
3.99%
1 janv. 2008
2.016 mds
-63.97 mln.
-3.08%
1 janv. 2009
1.978 mds
-37.703 mln.
-1.87%
1 janv. 2010
2.142 mds
+163.698 mln.
8.28%
1 janv. 2011
2.178 mds
+36.257 mln.
1.69%
1 janv. 2012
2.263 mds
+85.388 mln.
3.92%
1 janv. 2013
2.353 mds
+90.032 mln.
3.98%
1 janv. 2014
2.266 mds
-87.267 mln.
-3.71%
1 janv. 2015
2.327 mds
+60.964 mln.
2.69%
1 janv. 2016
2.333 mds
+6.146 mln.
0.26%
Classement des pays selon les statistiques actuelles par années


Commentaires: