29
/fr/
fr
AIzaSyAYiBZKx7MnpbEhh9jyipgxe19OcubqV5w
April 1, 2024
250483
St. Lucia
LCA
true
2
1
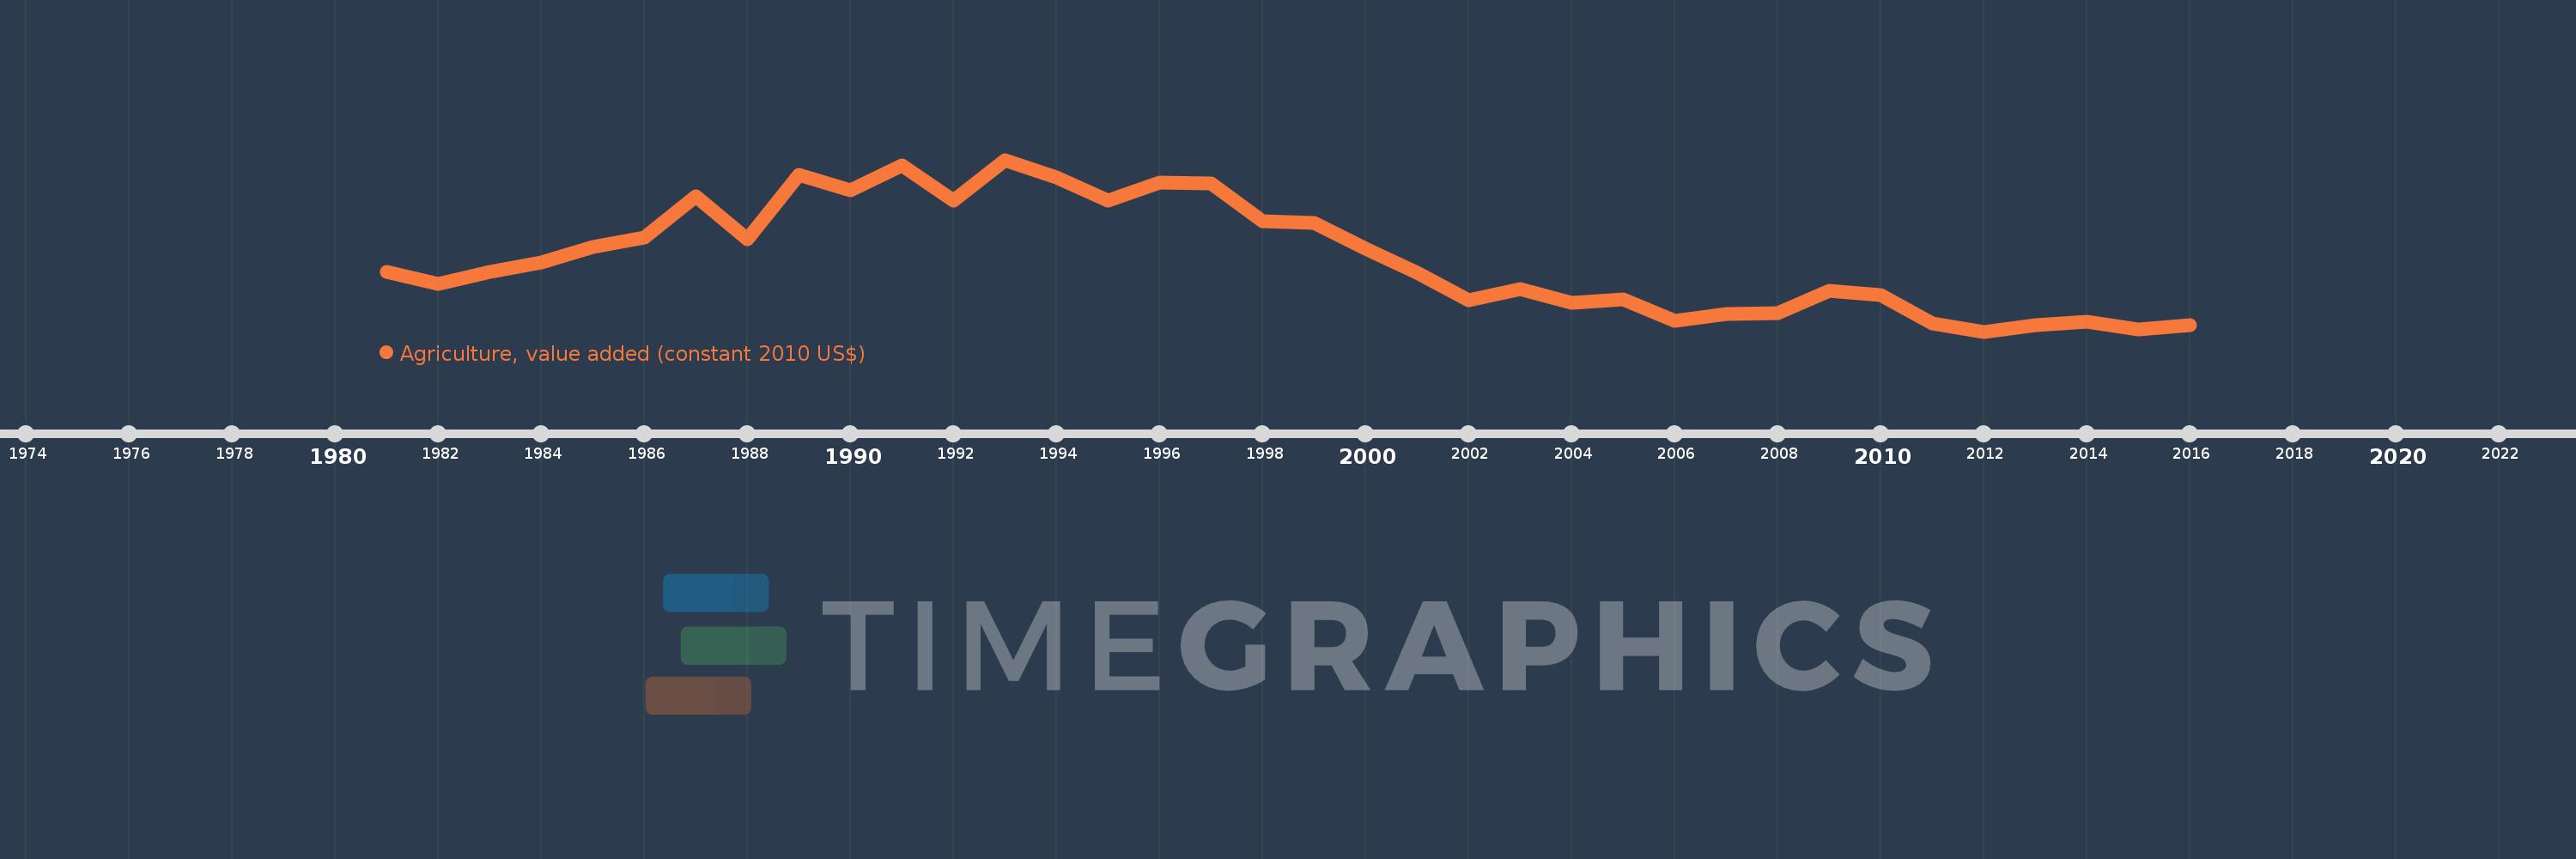
Agriculture, value added (constant 2010 US$)
2016,2015,2014,2013,2012,2011,2010,2009,2008,2007,2006,2005,2004,2003,2002,2001,2000,1999,1998,1997,1996,1995,1994,1993,1992,1991,1990,1989,1988,1987,1986,1985,1984,1983,1982,1981
Cette statistique dans les autres pays:
AfghanistanAlbaniaAlgeriaAndorraAntigua and BarbudaArab WorldArgentinaArmeniaArubaAustraliaAustriaAzerbaijanBahamas, TheBahrainBangladeshBarbadosBelarusBelgiumBelizeBeninBermudaBhutanBoliviaBosnia and HerzegovinaBotswanaBrazilBrunei DarussalamBulgariaBurkina FasoBurundiCabo VerdeCambodiaCameroonCanadaCaribbean small statesCentral African RepublicCentral Europe and the BalticsChadChileChinaColombiaComorosCongo, Dem. Rep.Congo, Rep.Costa RicaCote d'IvoireCroatiaCubaCyprusCzech RepublicDenmarkDominicaDominican RepublicEarly-demographic dividendEast Asia & PacificEast Asia & Pacific (excluding high income)East Asia & Pacific (IDA & IBRD countries)EcuadorEgypt, Arab Rep.El SalvadorEquatorial GuineaEstoniaEthiopiaEuro areaEurope & Central AsiaEurope & Central Asia (excluding high income)Europe & Central Asia (IDA & IBRD countries)European UnionFijiFinlandFragile and conflict affected situationsFranceGabonGambia, TheGeorgiaGermanyGhanaGreeceGrenadaGuatemalaGuineaGuinea-BissauGuyanaHeavily indebted poor countries (HIPC)High incomeHondurasHong Kong SAR, ChinaHungaryIBRD onlyIcelandIDA & IBRD totalIDA blendIDA onlyIDA totalIndiaIndonesiaIran, Islamic Rep.IraqIrelandItalyJamaicaJapanJordanKazakhstanKenyaKiribatiKorea, Rep.KosovoKuwaitKyrgyz RepublicLao PDRLate-demographic dividendLatin America & Caribbean Latin America & Caribbean (excluding high income)Latin America & the Caribbean (IDA & IBRD countries)LatviaLeast developed countries: UN classificationLebanonLesothoLiberiaLithuaniaLow & middle incomeLow incomeLower middle incomeLuxembourgMacao SAR, ChinaMacedonia, FYRMadagascarMalawiMalaysiaMaldivesMaliMaltaMarshall IslandsMauritaniaMauritiusMexicoMicronesia, Fed. Sts.Middle East & North AfricaMiddle East & North Africa (excluding high income)Middle East & North Africa (IDA & IBRD countries)Middle incomeMoldovaMongoliaMontenegroMoroccoMozambiqueMyanmarNamibiaNepalNetherlandsNew ZealandNicaraguaNigerNigeriaNorth AmericaNorwayOECD membersOmanOther small statesPakistanPalauPanamaParaguayPeruPhilippinesPolandPortugalPost-demographic dividendPre-demographic dividendPuerto RicoQatarRomaniaRussian FederationRwandaSamoaSao Tome and PrincipeSaudi ArabiaSenegalSerbiaSeychellesSierra LeoneSingaporeSlovak RepublicSloveniaSmall statesSouth AfricaSouth AsiaSouth Asia (IDA & IBRD)SpainSri LankaSt. Kitts and NevisSt. LuciaSt. Vincent and the GrenadinesSub-Saharan Africa Sub-Saharan Africa (excluding high income)Sub-Saharan Africa (IDA & IBRD countries)SudanSurinameSwazilandSwedenSwitzerlandTajikistanTanzaniaThailandTimor-LesteTogoTongaTrinidad and TobagoTunisiaTurkeyTurkmenistanTuvaluUgandaUkraineUnited Arab EmiratesUnited KingdomUnited StatesUpper middle incomeUruguayUzbekistanVanuatuVenezuela, RBVietnamWest Bank and GazaWorldYemen, Rep.ZambiaZimbabwe La ligne de temps
Cette échelle de temps montre un graphique de 1981 année à 2016 année St. Lucia. Les données jusqu'à 1980 année ne sont pas présentés. Quantité d'observations actuelles selon dates: 36.
Source (désignation):
Les indicateurs du développement mondiale
Source (organisation):
World Bank national accounts data, and OECD National Accounts data files.
Catégories:
Economy & Growth
Dernière mise à jour
23 avr. 2017
Les indicateurs de changement de valeurs selon les années
Minimum:
27.845 mln.
1 janv. 2012
Maximum:
108.015 mln.
1 janv. 1993
Pour la date d''observation
Valeur
Changement absolu
Le changement par rapport à la valeur précédente
1 janv. 1981
55.736 mln.
+55.736 mln.
0.0%
1 janv. 1982
50.118 mln.
-5.619 mln.
-10.08%
1 janv. 1983
55.736 mln.
+5.619 mln.
11.21%
1 janv. 1984
60.283 mln.
+4.547 mln.
8.16%
1 janv. 1985
67.208 mln.
+6.925 mln.
11.49%
1 janv. 1986
71.561 mln.
+4.353 mln.
6.48%
1 janv. 1987
90.908 mln.
+19.347 mln.
27.04%
1 janv. 1988
71.013 mln.
-19.896 mln.
-21.89%
1 janv. 1989
100.848 mln.
+29.835 mln.
42.01%
1 janv. 1990
93.609 mln.
-7.239 mln.
-7.18%
1 janv. 1991
105.282 mln.
+11.673 mln.
12.47%
1 janv. 1992
89.103 mln.
-16.179 mln.
-15.37%
1 janv. 1993
108.015 mln.
+18.912 mln.
21.22%
1 janv. 1994
99.784 mln.
-8.231 mln.
-7.62%
1 janv. 1995
89.159 mln.
-10.625 mln.
-10.65%
1 janv. 1996
97.486 mln.
+8.327 mln.
9.34%
1 janv. 1997
96.979 mln.
-507.885 milles
-0.52%
1 janv. 1998
79.308 mln.
-17.671 mln.
-18.22%
1 janv. 1999
78.357 mln.
-951.238 milles
-1.2%
1 janv. 2000
66.66 mln.
-11.697 mln.
-14.93%
1 janv. 2001
55.402 mln.
-11.257 mln.
-16.89%
1 janv. 2002
42.64 mln.
-12.762 mln.
-23.04%
1 janv. 2003
47.856 mln.
+5.216 mln.
12.23%
1 janv. 2004
41.297 mln.
-6.559 mln.
-13.71%
1 janv. 2005
42.925 mln.
+1.628 mln.
3.94%
1 janv. 2006
32.973 mln.
-9.952 mln.
-23.18%
1 janv. 2007
36.259 mln.
+3.286 mln.
9.97%
1 janv. 2008
36.455 mln.
+196.198 milles
0.54%
1 janv. 2009
46.717 mln.
+10.261 mln.
28.15%
1 janv. 2010
44.699 mln.
-2.018 mln.
-4.32%
1 janv. 2011
31.59 mln.
-13.109 mln.
-29.33%
1 janv. 2012
27.845 mln.
-3.745 mln.
-11.86%
1 janv. 2013
31.013 mln.
+3.168 mln.
11.38%
1 janv. 2014
32.635 mln.
+1.622 mln.
5.23%
1 janv. 2015
28.942 mln.
-3.693 mln.
-11.32%
1 janv. 2016
30.965 mln.
+2.023 mln.
6.99%
Classement des pays selon les statistiques actuelles par années


Commentaires: