29
/fr/
fr
AIzaSyAYiBZKx7MnpbEhh9jyipgxe19OcubqV5w
April 1, 2024
254866
Swaziland
SWZ
true
2
1
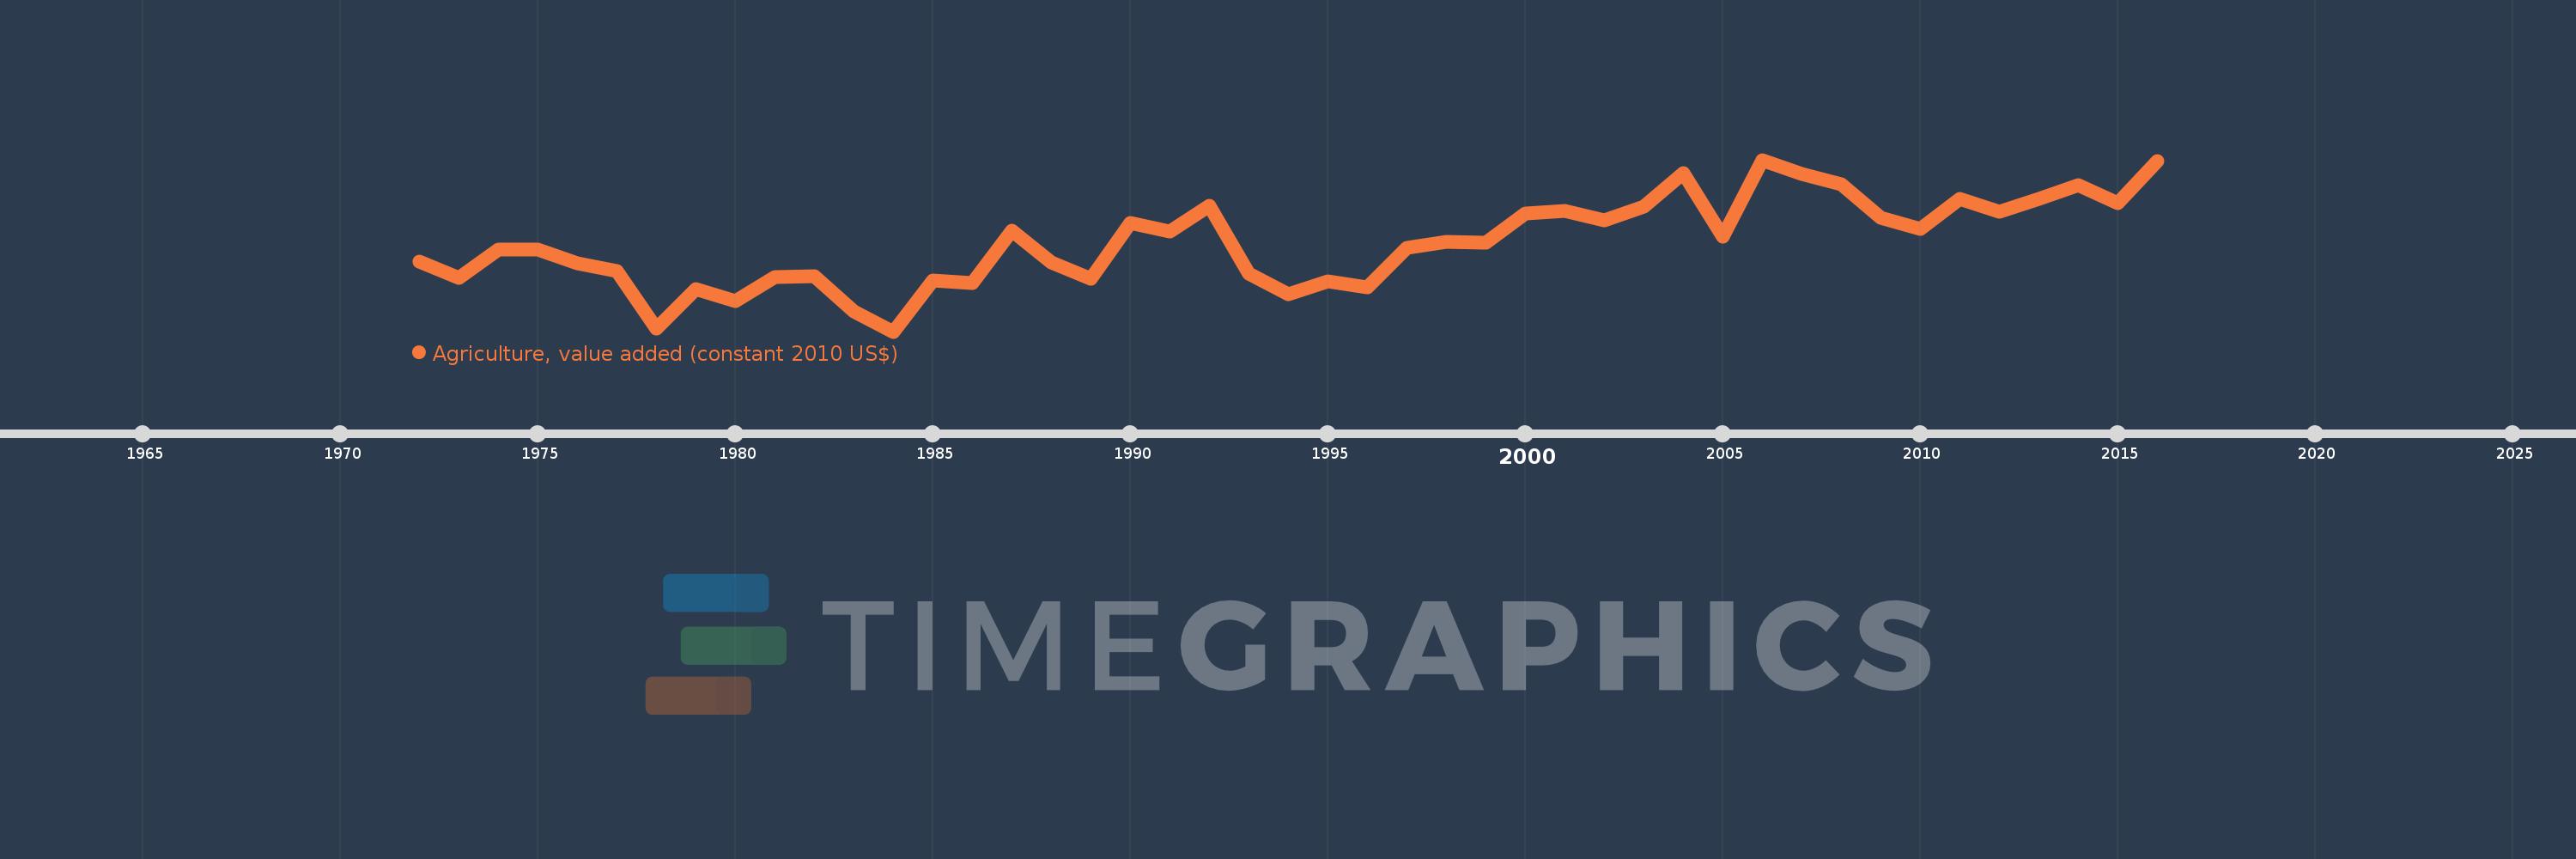
Agriculture, value added (constant 2010 US$)
2016,2015,2014,2013,2012,2011,2010,2009,2008,2007,2006,2005,2004,2003,2002,2001,2000,1999,1998,1997,1996,1995,1994,1993,1992,1991,1990,1989,1988,1987,1986,1985,1984,1983,1982,1981,1980,1979,1978,1977,1976,1975,1974,1973,1972
Cette statistique dans les autres pays:
AfghanistanAlbaniaAlgeriaAndorraAntigua and BarbudaArab WorldArgentinaArmeniaArubaAustraliaAustriaAzerbaijanBahamas, TheBahrainBangladeshBarbadosBelarusBelgiumBelizeBeninBermudaBhutanBoliviaBosnia and HerzegovinaBotswanaBrazilBrunei DarussalamBulgariaBurkina FasoBurundiCabo VerdeCambodiaCameroonCanadaCaribbean small statesCentral African RepublicCentral Europe and the BalticsChadChileChinaColombiaComorosCongo, Dem. Rep.Congo, Rep.Costa RicaCote d'IvoireCroatiaCubaCyprusCzech RepublicDenmarkDominicaDominican RepublicEarly-demographic dividendEast Asia & PacificEast Asia & Pacific (excluding high income)East Asia & Pacific (IDA & IBRD countries)EcuadorEgypt, Arab Rep.El SalvadorEquatorial GuineaEstoniaEthiopiaEuro areaEurope & Central AsiaEurope & Central Asia (excluding high income)Europe & Central Asia (IDA & IBRD countries)European UnionFijiFinlandFragile and conflict affected situationsFranceGabonGambia, TheGeorgiaGermanyGhanaGreeceGrenadaGuatemalaGuineaGuinea-BissauGuyanaHeavily indebted poor countries (HIPC)High incomeHondurasHong Kong SAR, ChinaHungaryIBRD onlyIcelandIDA & IBRD totalIDA blendIDA onlyIDA totalIndiaIndonesiaIran, Islamic Rep.IraqIrelandItalyJamaicaJapanJordanKazakhstanKenyaKiribatiKorea, Rep.KosovoKuwaitKyrgyz RepublicLao PDRLate-demographic dividendLatin America & Caribbean Latin America & Caribbean (excluding high income)Latin America & the Caribbean (IDA & IBRD countries)LatviaLeast developed countries: UN classificationLebanonLesothoLiberiaLithuaniaLow & middle incomeLow incomeLower middle incomeLuxembourgMacao SAR, ChinaMacedonia, FYRMadagascarMalawiMalaysiaMaldivesMaliMaltaMarshall IslandsMauritaniaMauritiusMexicoMicronesia, Fed. Sts.Middle East & North AfricaMiddle East & North Africa (excluding high income)Middle East & North Africa (IDA & IBRD countries)Middle incomeMoldovaMongoliaMontenegroMoroccoMozambiqueMyanmarNamibiaNepalNetherlandsNew ZealandNicaraguaNigerNigeriaNorth AmericaNorwayOECD membersOmanOther small statesPakistanPalauPanamaParaguayPeruPhilippinesPolandPortugalPost-demographic dividendPre-demographic dividendPuerto RicoQatarRomaniaRussian FederationRwandaSamoaSao Tome and PrincipeSaudi ArabiaSenegalSerbiaSeychellesSierra LeoneSingaporeSlovak RepublicSloveniaSmall statesSouth AfricaSouth AsiaSouth Asia (IDA & IBRD)SpainSri LankaSt. Kitts and NevisSt. LuciaSt. Vincent and the GrenadinesSub-Saharan Africa Sub-Saharan Africa (excluding high income)Sub-Saharan Africa (IDA & IBRD countries)SudanSurinameSwazilandSwedenSwitzerlandTajikistanTanzaniaThailandTimor-LesteTogoTongaTrinidad and TobagoTunisiaTurkeyTurkmenistanTuvaluUgandaUkraineUnited Arab EmiratesUnited KingdomUnited StatesUpper middle incomeUruguayUzbekistanVanuatuVenezuela, RBVietnamWest Bank and GazaWorldYemen, Rep.ZambiaZimbabwe La ligne de temps
Cette échelle de temps montre un graphique de 1972 année à 2016 année Swaziland. Les données jusqu'à 1971 année ne sont pas présentés. Quantité d'observations actuelles selon dates: 45.
Source (désignation):
Les indicateurs du développement mondiale
Source (organisation):
World Bank national accounts data, and OECD National Accounts data files.
Catégories:
Economy & Growth
Dernière mise à jour
23 avr. 2017
Les indicateurs de changement de valeurs selon les années
Minimum:
212.826 mln.
1 janv. 1984
Maximum:
363.968 mln.
1 janv. 2006
Pour la date d''observation
Valeur
Changement absolu
Le changement par rapport à la valeur précédente
1 janv. 1972
274.197 mln.
+274.197 mln.
0.0%
1 janv. 1973
259.933 mln.
-14.263 mln.
-5.2%
1 janv. 1974
285.27 mln.
+25.336 mln.
9.75%
1 janv. 1975
285.27 mln.
0.0
0.0%
1 janv. 1976
272.695 mln.
-12.574 mln.
-4.41%
1 janv. 1977
265.939 mln.
-6.756 mln.
-2.48%
1 janv. 1978
215.454 mln.
-50.485 mln.
-18.98%
1 janv. 1979
250.174 mln.
+34.72 mln.
16.11%
1 janv. 1980
239.852 mln.
-10.322 mln.
-4.13%
1 janv. 1981
260.562 mln.
+20.71 mln.
8.63%
1 janv. 1982
261.81 mln.
+1.248 mln.
0.48%
1 janv. 1983
230.28 mln.
-31.53 mln.
-12.04%
1 janv. 1984
212.826 mln.
-17.454 mln.
-7.58%
1 janv. 1985
257.869 mln.
+45.043 mln.
21.16%
1 janv. 1986
255.241 mln.
-2.627 mln.
-1.02%
1 janv. 1987
301.41 mln.
+46.169 mln.
18.09%
1 janv. 1988
274.009 mln.
-27.401 mln.
-9.09%
1 janv. 1989
258.995 mln.
-15.014 mln.
-5.48%
1 janv. 1990
308.354 mln.
+49.359 mln.
19.06%
1 janv. 1991
301.137 mln.
-7.216 mln.
-2.34%
1 janv. 1992
323.394 mln.
+22.256 mln.
7.39%
1 janv. 1993
264.154 mln.
-59.24 mln.
-18.32%
1 janv. 1994
245.482 mln.
-18.672 mln.
-7.07%
1 janv. 1995
256.745 mln.
+11.264 mln.
4.59%
1 janv. 1996
251.716 mln.
-5.03 mln.
-1.96%
1 janv. 1997
286.41 mln.
+34.694 mln.
13.78%
1 janv. 1998
291.681 mln.
+5.27 mln.
1.84%
1 janv. 1999
291.229 mln.
-451.75 milles
-0.15%
1 janv. 2000
316.798 mln.
+25.569 mln.
8.78%
1 janv. 2001
319.268 mln.
+2.47 mln.
0.78%
1 janv. 2002
310.672 mln.
-8.595 mln.
-2.69%
1 janv. 2003
322.835 mln.
+12.163 mln.
3.92%
1 janv. 2004
352.624 mln.
+29.789 mln.
9.23%
1 janv. 2005
296.161 mln.
-56.463 mln.
-16.01%
1 janv. 2006
363.968 mln.
+67.808 mln.
22.9%
1 janv. 2007
351.158 mln.
-12.81 mln.
-3.52%
1 janv. 2008
342.547 mln.
-8.611 mln.
-2.45%
1 janv. 2009
313.07 mln.
-29.477 mln.
-8.61%
1 janv. 2010
302.953 mln.
-10.117 mln.
-3.23%
1 janv. 2011
329.88 mln.
+26.927 mln.
8.89%
1 janv. 2012
318.462 mln.
-11.418 mln.
-3.46%
1 janv. 2013
329.543 mln.
+11.081 mln.
3.48%
1 janv. 2014
341.359 mln.
+11.816 mln.
3.59%
1 janv. 2015
326.016 mln.
-15.342 mln.
-4.49%
1 janv. 2016
362.899 mln.
+36.883 mln.
11.31%
Classement des pays selon les statistiques actuelles par années


Commentaires: