29
/fr/
fr
AIzaSyAYiBZKx7MnpbEhh9jyipgxe19OcubqV5w
April 1, 2024
91022
Brazil
BRA
true
2
1
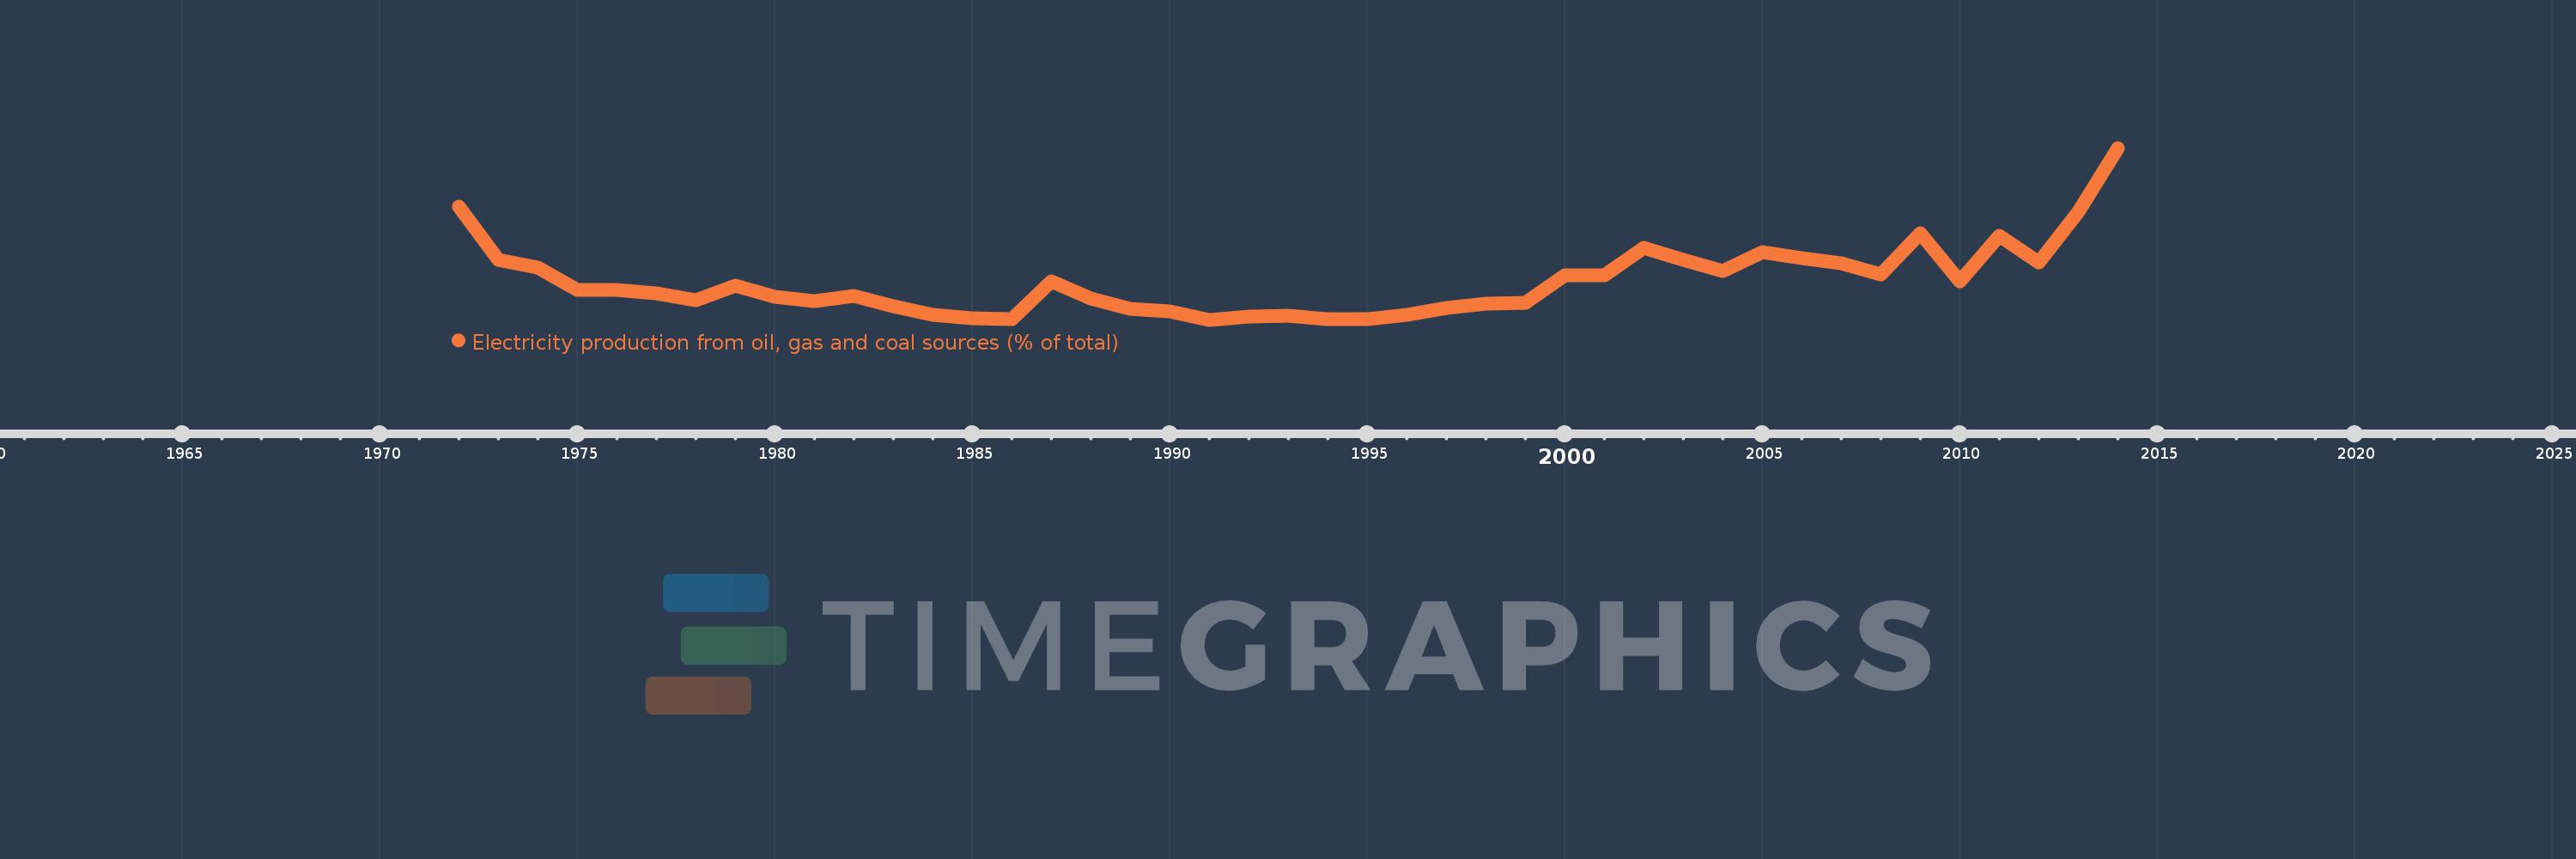
Electricity production from oil, gas and coal sources (% of total)
2014,2013,2012,2011,2010,2009,2008,2007,2006,2005,2004,2003,2002,2001,2000,1999,1998,1997,1996,1995,1994,1993,1992,1991,1990,1989,1988,1987,1986,1985,1984,1983,1982,1981,1980,1979,1978,1977,1976,1975,1974,1973,1972
Cette statistique dans les autres pays:
AlbaniaAlgeriaAngolaArab WorldArgentinaArmeniaAustraliaAustriaAzerbaijanBahrainBangladeshBelarusBelgiumBeninBoliviaBosnia and HerzegovinaBotswanaBrazilBrunei DarussalamBulgariaCambodiaCameroonCanadaCentral Europe and the BalticsChileChinaColombiaCongo, Dem. Rep.Congo, Rep.Costa RicaCote d'IvoireCroatiaCubaCuracaoCyprusCzech RepublicDenmarkDominican RepublicEarly-demographic dividendEast Asia & PacificEast Asia & Pacific (excluding high income)East Asia & Pacific (IDA & IBRD countries)EcuadorEgypt, Arab Rep.El SalvadorEritreaEstoniaEthiopiaEuro areaEurope & Central AsiaEurope & Central Asia (excluding high income)Europe & Central Asia (IDA & IBRD countries)European UnionFinlandFragile and conflict affected situationsFranceGabonGeorgiaGermanyGhanaGibraltarGreeceGuatemalaHaitiHeavily indebted poor countries (HIPC)High incomeHondurasHong Kong SAR, ChinaHungaryIBRD onlyIcelandIDA & IBRD totalIDA blendIDA onlyIDA totalIndiaIndonesiaIran, Islamic Rep.IraqIrelandIsraelItalyJamaicaJapanJordanKazakhstanKenyaKorea, Dem. People’s Rep.Korea, Rep.KosovoKuwaitKyrgyz RepublicLate-demographic dividendLatin America & Caribbean Latin America & Caribbean (excluding high income)Latin America & the Caribbean (IDA & IBRD countries)LatviaLeast developed countries: UN classificationLebanonLibyaLithuaniaLow & middle incomeLower middle incomeLuxembourgMacedonia, FYRMalaysiaMaltaMauritiusMexicoMiddle East & North AfricaMiddle East & North Africa (excluding high income)Middle East & North Africa (IDA & IBRD countries)Middle incomeMoldovaMongoliaMontenegroMoroccoMozambiqueMyanmarNamibiaNepalNetherlandsNew ZealandNicaraguaNigerNigeriaNorth AmericaNorwayOECD membersOmanOther small statesPakistanPanamaParaguayPeruPhilippinesPolandPortugalPost-demographic dividendPre-demographic dividendQatarRomaniaRussian FederationSaudi ArabiaSenegalSerbiaSingaporeSlovak RepublicSloveniaSmall statesSouth AfricaSouth AsiaSouth Asia (IDA & IBRD)South SudanSpainSri LankaSub-Saharan Africa Sub-Saharan Africa (excluding high income)Sub-Saharan Africa (IDA & IBRD countries)SudanSwedenSwitzerlandSyrian Arab RepublicTajikistanTanzaniaThailandTogoTrinidad and TobagoTunisiaTurkeyTurkmenistanUkraineUnited Arab EmiratesUnited KingdomUnited StatesUpper middle incomeUruguayUzbekistanVenezuela, RBVietnamWorldYemen, Rep.ZambiaZimbabwe La ligne de temps
Cette échelle de temps montre un graphique de 1972 année à 2014 année Brazil. Les données jusqu'à 1971 année ne sont pas présentés. Quantité d'observations actuelles selon dates: 43.
Source (désignation):
Les indicateurs du développement mondiale
Source (organisation):
IEA Statistics © OECD/IEA 2014 (http://www.iea.org/stats/index.asp), subject to https://www.iea.org/t&c/termsandconditions/
Catégories:
Energy & Mining, Environment
Dernière mise à jour
23 avr. 2017
Les indicateurs de changement de valeurs selon les années
Minimum:
4.496
1 janv. 1991
Maximum:
20.574
1 janv. 2014
Pour la date d''observation
Valeur
Changement absolu
Le changement par rapport à la valeur précédente
1 janv. 1972
15.047
+15.047
0.0%
1 janv. 1973
10.085
-4.962
-32.98%
1 janv. 1974
9.403
-0.682
-6.76%
1 janv. 1975
7.301
-2.101
-22.35%
1 janv. 1976
7.325
+0.024
0.32%
1 janv. 1977
6.949
-0.376
-5.14%
1 janv. 1978
6.351
-0.598
-8.6%
1 janv. 1979
7.674
+1.323
20.84%
1 janv. 1980
6.641
-1.033
-13.46%
1 janv. 1981
6.219
-0.422
-6.35%
1 janv. 1982
6.716
+0.497
7.99%
1 janv. 1983
5.772
-0.944
-14.05%
1 janv. 1984
4.944
-0.828
-14.35%
1 janv. 1985
4.628
-0.316
-6.4%
1 janv. 1986
4.575
-0.053
-1.15%
1 janv. 1987
8.1
+3.525
77.06%
1 janv. 1988
6.488
-1.611
-19.89%
1 janv. 1989
5.54
-0.949
-14.62%
1 janv. 1990
5.236
-0.303
-5.47%
1 janv. 1991
4.496
-0.741
-14.15%
1 janv. 1992
4.759
+0.263
5.86%
1 janv. 1993
4.853
+0.094
1.97%
1 janv. 1994
4.57
-0.283
-5.83%
1 janv. 1995
4.574
+0.004
0.08%
1 janv. 1996
4.929
+0.355
7.76%
1 janv. 1997
5.606
+0.677
13.74%
1 janv. 1998
5.993
+0.388
6.91%
1 janv. 1999
6.062
+0.069
1.15%
1 janv. 2000
8.666
+2.604
42.95%
1 janv. 2001
8.668
+0.002
0.03%
1 janv. 2002
11.233
+2.565
29.6%
1 janv. 2003
10.139
-1.094
-9.74%
1 janv. 2004
9.046
-1.093
-10.78%
1 janv. 2005
10.833
+1.787
19.76%
1 janv. 2006
10.23
-0.603
-5.57%
1 janv. 2007
9.809
-0.422
-4.12%
1 janv. 2008
8.745
-1.064
-10.85%
1 janv. 2009
12.613
+3.869
44.24%
1 janv. 2010
8.099
-4.514
-35.79%
1 janv. 2011
12.386
+4.286
52.92%
1 janv. 2012
9.83
-2.556
-20.64%
1 janv. 2013
14.597
+4.767
48.5%
1 janv. 2014
20.574
+5.977
40.95%
Classement des pays selon les statistiques actuelles par années


Commentaires: