29
/fr/
fr
AIzaSyAYiBZKx7MnpbEhh9jyipgxe19OcubqV5w
April 1, 2024
140265
Ghana
GHA
true
2
1
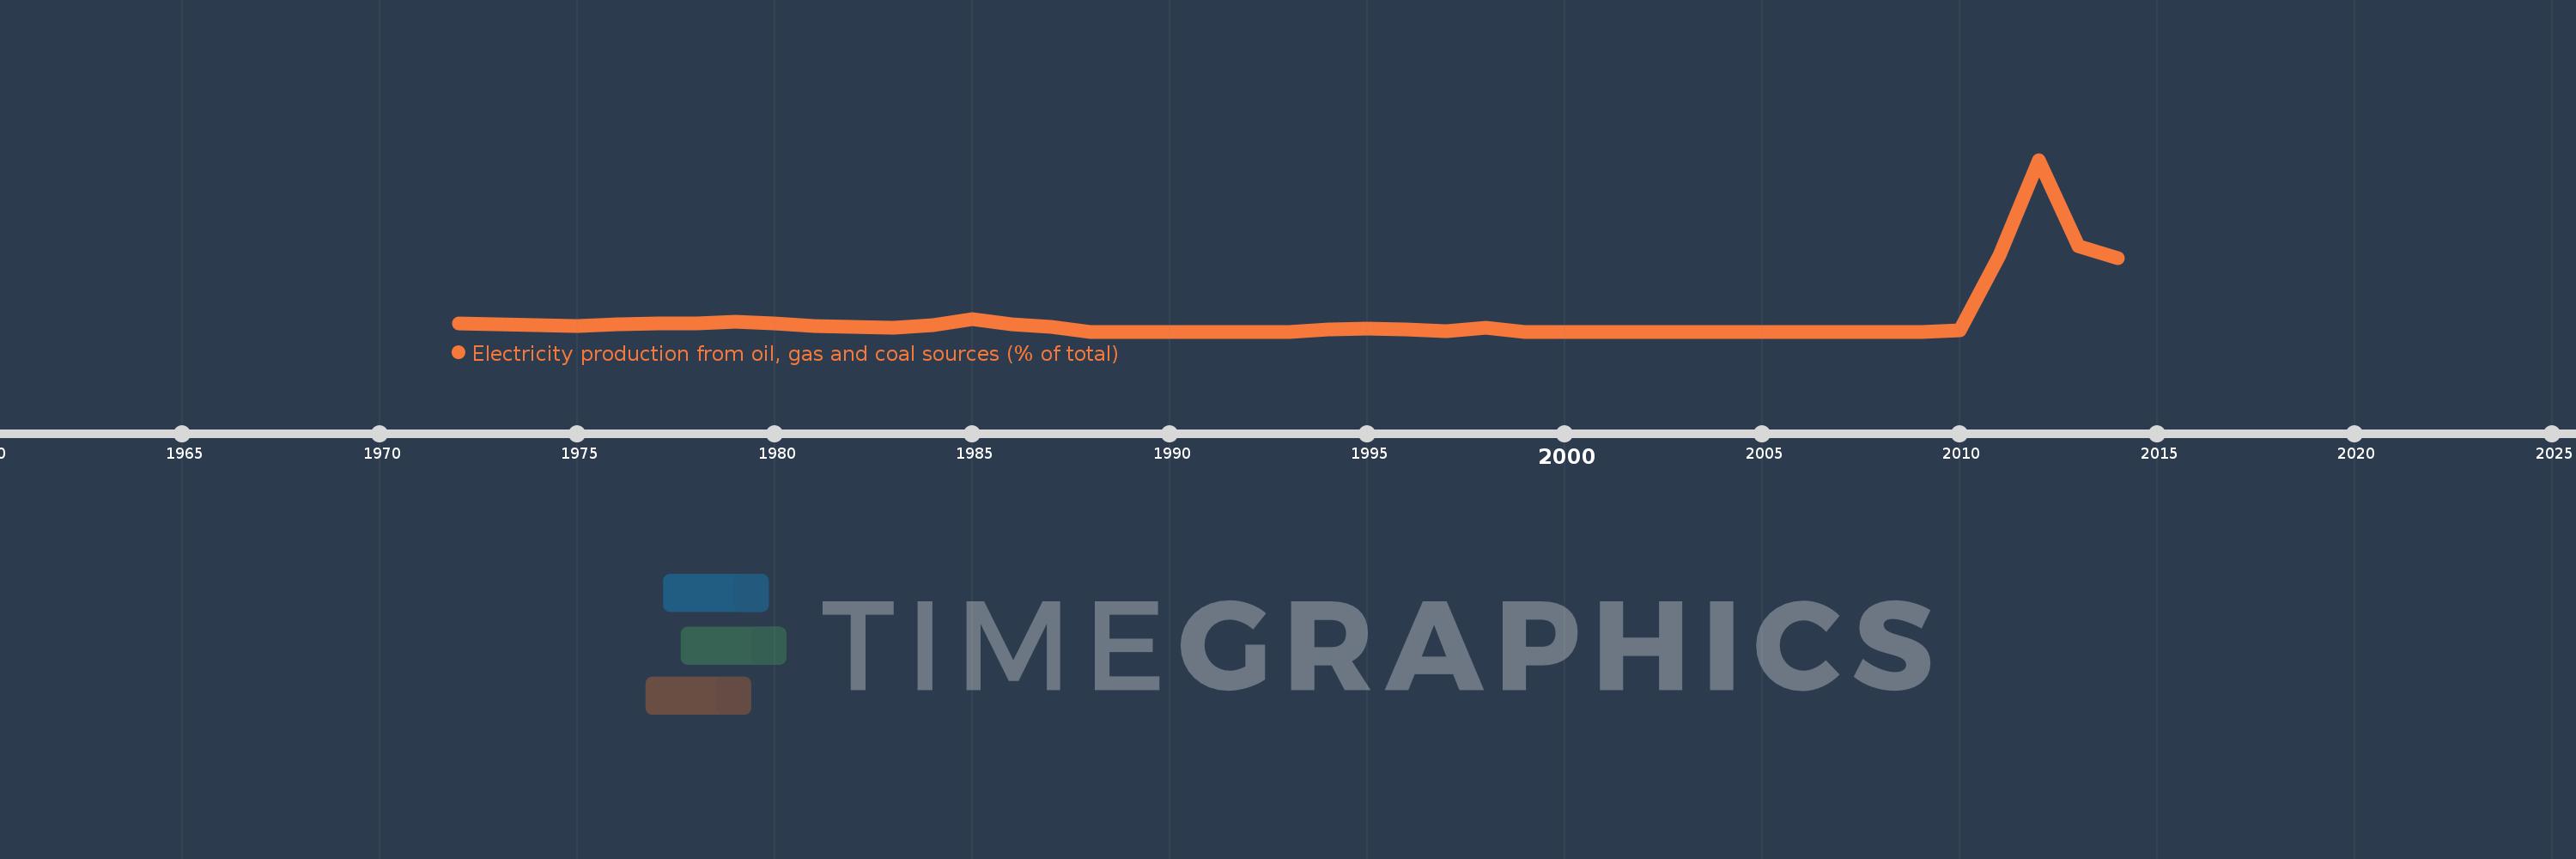
Electricity production from oil, gas and coal sources (% of total)
2014,2013,2012,2011,2010,2009,2008,2007,2006,2005,2004,2003,2002,2001,2000,1999,1998,1997,1996,1995,1994,1993,1992,1991,1990,1989,1988,1987,1986,1985,1984,1983,1982,1981,1980,1979,1978,1977,1976,1975,1974,1973,1972
Cette statistique dans les autres pays:
AlbaniaAlgeriaAngolaArab WorldArgentinaArmeniaAustraliaAustriaAzerbaijanBahrainBangladeshBelarusBelgiumBeninBoliviaBosnia and HerzegovinaBotswanaBrazilBrunei DarussalamBulgariaCambodiaCameroonCanadaCentral Europe and the BalticsChileChinaColombiaCongo, Dem. Rep.Congo, Rep.Costa RicaCote d'IvoireCroatiaCubaCuracaoCyprusCzech RepublicDenmarkDominican RepublicEarly-demographic dividendEast Asia & PacificEast Asia & Pacific (excluding high income)East Asia & Pacific (IDA & IBRD countries)EcuadorEgypt, Arab Rep.El SalvadorEritreaEstoniaEthiopiaEuro areaEurope & Central AsiaEurope & Central Asia (excluding high income)Europe & Central Asia (IDA & IBRD countries)European UnionFinlandFragile and conflict affected situationsFranceGabonGeorgiaGermanyGhanaGibraltarGreeceGuatemalaHaitiHeavily indebted poor countries (HIPC)High incomeHondurasHong Kong SAR, ChinaHungaryIBRD onlyIcelandIDA & IBRD totalIDA blendIDA onlyIDA totalIndiaIndonesiaIran, Islamic Rep.IraqIrelandIsraelItalyJamaicaJapanJordanKazakhstanKenyaKorea, Dem. People’s Rep.Korea, Rep.KosovoKuwaitKyrgyz RepublicLate-demographic dividendLatin America & Caribbean Latin America & Caribbean (excluding high income)Latin America & the Caribbean (IDA & IBRD countries)LatviaLeast developed countries: UN classificationLebanonLibyaLithuaniaLow & middle incomeLower middle incomeLuxembourgMacedonia, FYRMalaysiaMaltaMauritiusMexicoMiddle East & North AfricaMiddle East & North Africa (excluding high income)Middle East & North Africa (IDA & IBRD countries)Middle incomeMoldovaMongoliaMontenegroMoroccoMozambiqueMyanmarNamibiaNepalNetherlandsNew ZealandNicaraguaNigerNigeriaNorth AmericaNorwayOECD membersOmanOther small statesPakistanPanamaParaguayPeruPhilippinesPolandPortugalPost-demographic dividendPre-demographic dividendQatarRomaniaRussian FederationSaudi ArabiaSenegalSerbiaSingaporeSlovak RepublicSloveniaSmall statesSouth AfricaSouth AsiaSouth Asia (IDA & IBRD)South SudanSpainSri LankaSub-Saharan Africa Sub-Saharan Africa (excluding high income)Sub-Saharan Africa (IDA & IBRD countries)SudanSwedenSwitzerlandSyrian Arab RepublicTajikistanTanzaniaThailandTogoTrinidad and TobagoTunisiaTurkeyTurkmenistanUkraineUnited Arab EmiratesUnited KingdomUnited StatesUpper middle incomeUruguayUzbekistanVenezuela, RBVietnamWorldYemen, Rep.ZambiaZimbabwe La ligne de temps
Cette échelle de temps montre un graphique de 1972 année à 2014 année Ghana. Les données jusqu'à 1971 année ne sont pas présentés. Quantité d'observations actuelles selon dates: 43.
Source (désignation):
Les indicateurs du développement mondiale
Source (organisation):
IEA Statistics © OECD/IEA 2014 (http://www.iea.org/stats/index.asp), subject to https://www.iea.org/t&c/termsandconditions/
Catégories:
Energy & Mining, Environment
Dernière mise à jour
23 avr. 2017
Les indicateurs de changement de valeurs selon les années
Maximum:
24.339
1 janv. 2012
Pour la date d''observation
Valeur
Changement absolu
Le changement par rapport à la valeur précédente
1 janv. 1972
1.189
+1.189
0.0%
1 janv. 1973
1.072
-0.116
-9.8%
1 janv. 1974
0.972
-0.101
-9.37%
1 janv. 1975
0.754
-0.217
-22.37%
1 janv. 1976
0.978
+0.223
29.62%
1 janv. 1977
1.113
+0.136
13.86%
1 janv. 1978
1.147
+0.034
3.04%
1 janv. 1979
1.378
+0.231
20.12%
1 janv. 1980
1.132
-0.247
-17.9%
1 janv. 1981
0.771
-0.36
-31.85%
1 janv. 1982
0.651
-0.12
-15.57%
1 janv. 1983
0.563
-0.088
-13.45%
1 janv. 1984
0.933
+0.37
65.6%
1 janv. 1985
1.801
+0.868
93.04%
1 janv. 1986
1.027
-0.774
-42.98%
1 janv. 1987
0.682
-0.346
-33.65%
1 janv. 1988
0.0
-0.682
-100.0%
1 janv. 1994
0.348
+0.348
%
1 janv. 1995
0.458
+0.11
31.5%
1 janv. 1996
0.311
-0.148
-32.21%
1 janv. 1997
0.03
-0.28
-90.29%
1 janv. 1998
0.508
+0.478
1.58 milles%
1 janv. 1999
0.0
-0.508
-100.0%
1 janv. 2010
0.223
+0.223
%
1 janv. 2011
10.78
+10.557
4.73 milles%
1 janv. 2012
24.339
+13.559
125.78%
1 janv. 2013
12.084
-12.255
-50.35%
1 janv. 2014
10.403
-1.681
-13.91%
Classement des pays selon les statistiques actuelles par années


Commentaires: