29
/fr/
fr
AIzaSyAYiBZKx7MnpbEhh9jyipgxe19OcubqV5w
April 1, 2024
139162
Germany
DEU
true
2
1
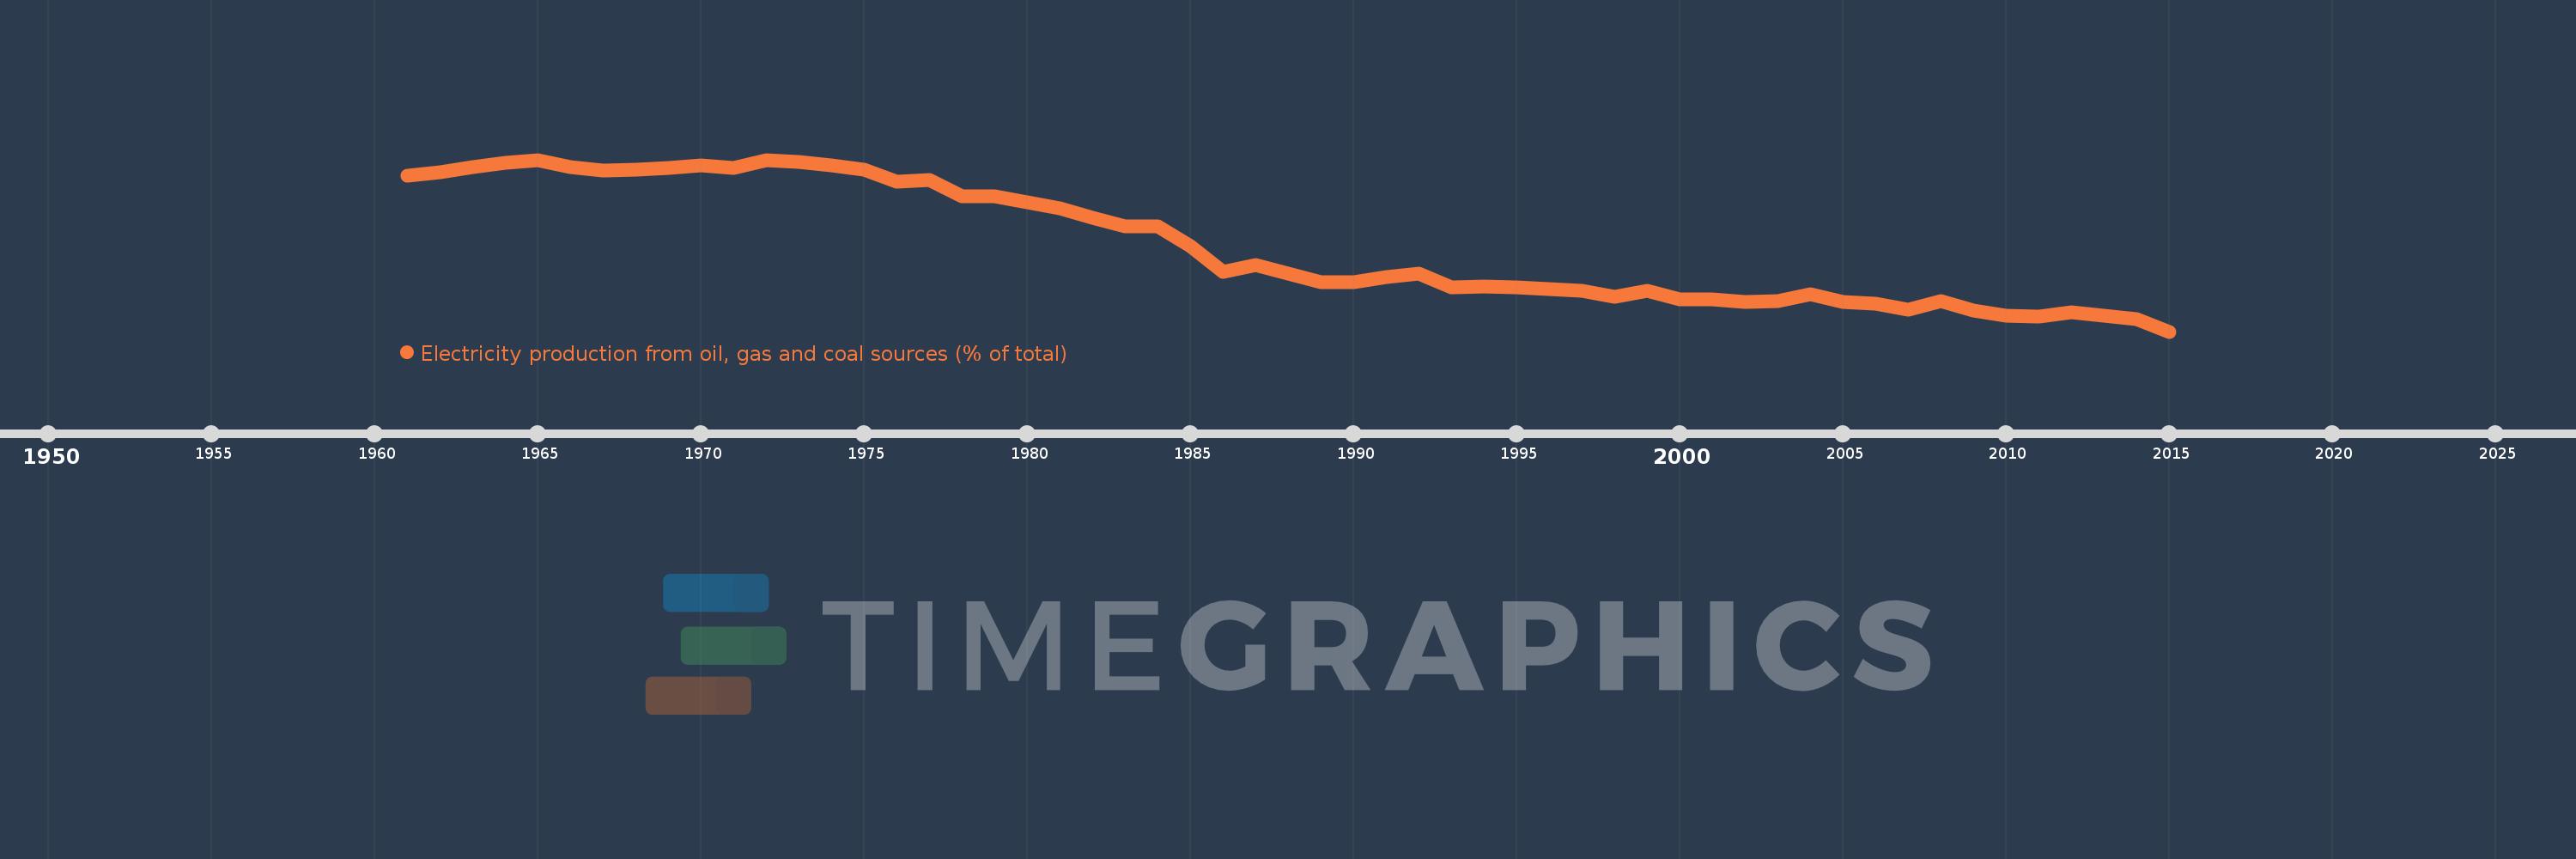
Electricity production from oil, gas and coal sources (% of total)
2015,2014,2013,2012,2011,2010,2009,2008,2007,2006,2005,2004,2003,2002,2001,2000,1999,1998,1997,1996,1995,1994,1993,1992,1991,1990,1989,1988,1987,1986,1985,1984,1983,1982,1981,1980,1979,1978,1977,1976,1975,1974,1973,1972,1971,1970,1969,1968,1967,1966,1965,1964,1963,1962,1961
Cette statistique dans les autres pays:
AlbaniaAlgeriaAngolaArab WorldArgentinaArmeniaAustraliaAustriaAzerbaijanBahrainBangladeshBelarusBelgiumBeninBoliviaBosnia and HerzegovinaBotswanaBrazilBrunei DarussalamBulgariaCambodiaCameroonCanadaCentral Europe and the BalticsChileChinaColombiaCongo, Dem. Rep.Congo, Rep.Costa RicaCote d'IvoireCroatiaCubaCuracaoCyprusCzech RepublicDenmarkDominican RepublicEarly-demographic dividendEast Asia & PacificEast Asia & Pacific (excluding high income)East Asia & Pacific (IDA & IBRD countries)EcuadorEgypt, Arab Rep.El SalvadorEritreaEstoniaEthiopiaEuro areaEurope & Central AsiaEurope & Central Asia (excluding high income)Europe & Central Asia (IDA & IBRD countries)European UnionFinlandFragile and conflict affected situationsFranceGabonGeorgiaGermanyGhanaGibraltarGreeceGuatemalaHaitiHeavily indebted poor countries (HIPC)High incomeHondurasHong Kong SAR, ChinaHungaryIBRD onlyIcelandIDA & IBRD totalIDA blendIDA onlyIDA totalIndiaIndonesiaIran, Islamic Rep.IraqIrelandIsraelItalyJamaicaJapanJordanKazakhstanKenyaKorea, Dem. People’s Rep.Korea, Rep.KosovoKuwaitKyrgyz RepublicLate-demographic dividendLatin America & Caribbean Latin America & Caribbean (excluding high income)Latin America & the Caribbean (IDA & IBRD countries)LatviaLeast developed countries: UN classificationLebanonLibyaLithuaniaLow & middle incomeLower middle incomeLuxembourgMacedonia, FYRMalaysiaMaltaMauritiusMexicoMiddle East & North AfricaMiddle East & North Africa (excluding high income)Middle East & North Africa (IDA & IBRD countries)Middle incomeMoldovaMongoliaMontenegroMoroccoMozambiqueMyanmarNamibiaNepalNetherlandsNew ZealandNicaraguaNigerNigeriaNorth AmericaNorwayOECD membersOmanOther small statesPakistanPanamaParaguayPeruPhilippinesPolandPortugalPost-demographic dividendPre-demographic dividendQatarRomaniaRussian FederationSaudi ArabiaSenegalSerbiaSingaporeSlovak RepublicSloveniaSmall statesSouth AfricaSouth AsiaSouth Asia (IDA & IBRD)South SudanSpainSri LankaSub-Saharan Africa Sub-Saharan Africa (excluding high income)Sub-Saharan Africa (IDA & IBRD countries)SudanSwedenSwitzerlandSyrian Arab RepublicTajikistanTanzaniaThailandTogoTrinidad and TobagoTunisiaTurkeyTurkmenistanUkraineUnited Arab EmiratesUnited KingdomUnited StatesUpper middle incomeUruguayUzbekistanVenezuela, RBVietnamWorldYemen, Rep.ZambiaZimbabwe La ligne de temps
Cette échelle de temps montre un graphique de 1961 année à 2015 année Germany. Les données jusqu'à 1960 année ne sont pas présentés. Quantité d'observations actuelles selon dates: 55.
Source (désignation):
Les indicateurs du développement mondiale
Source (organisation):
IEA Statistics © OECD/IEA 2014 (http://www.iea.org/stats/index.asp), subject to https://www.iea.org/t&c/termsandconditions/
Catégories:
Energy & Mining, Environment
Dernière mise à jour
23 avr. 2017
Les indicateurs de changement de valeurs selon les années
Minimum:
56.276
1 janv. 2015
Maximum:
93.164
1 janv. 1965
Pour la date d''observation
Valeur
Changement absolu
Le changement par rapport à la valeur précédente
1 janv. 1961
89.808
+89.808
0.0%
1 janv. 1962
90.544
+0.737
0.82%
1 janv. 1963
91.618
+1.074
1.19%
1 janv. 1964
92.463
+0.844
0.92%
1 janv. 1965
93.164
+0.702
0.76%
1 janv. 1966
91.612
-1.552
-1.67%
1 janv. 1967
90.904
-0.708
-0.77%
1 janv. 1968
90.986
+0.082
0.09%
1 janv. 1969
91.399
+0.413
0.45%
1 janv. 1970
91.962
+0.563
0.62%
1 janv. 1971
91.397
-0.566
-0.61%
1 janv. 1972
93.143
+1.747
1.91%
1 janv. 1973
92.617
-0.527
-0.57%
1 janv. 1974
91.919
-0.697
-0.75%
1 janv. 1975
91.019
-0.9
-0.98%
1 janv. 1976
88.456
-2.563
-2.82%
1 janv. 1977
88.868
+0.411
0.47%
1 janv. 1978
85.383
-3.484
-3.92%
1 janv. 1979
85.295
-0.088
-0.1%
1 janv. 1980
84.081
-1.214
-1.42%
1 janv. 1981
82.825
-1.256
-1.49%
1 janv. 1982
80.667
-2.158
-2.61%
1 janv. 1983
78.822
-1.845
-2.29%
1 janv. 1984
78.812
-0.009
-0.01%
1 janv. 1985
74.697
-4.116
-5.22%
1 janv. 1986
69.157
-5.54
-7.42%
1 janv. 1987
70.589
+1.433
2.07%
1 janv. 1988
68.695
-1.894
-2.68%
1 janv. 1989
66.84
-1.855
-2.7%
1 janv. 1990
66.854
+0.014
0.02%
1 janv. 1991
68.018
+1.163
1.74%
1 janv. 1992
68.636
+0.618
0.91%
1 janv. 1993
65.764
-2.872
-4.18%
1 janv. 1994
65.927
+0.163
0.25%
1 janv. 1995
65.862
-0.065
-0.1%
1 janv. 1996
65.413
-0.45
-0.68%
1 janv. 1997
65.127
-0.286
-0.44%
1 janv. 1998
63.686
-1.441
-2.21%
1 janv. 1999
65.019
+1.334
2.09%
1 janv. 2000
63.178
-1.842
-2.83%
1 janv. 2001
63.155
-0.023
-0.04%
1 janv. 2002
62.699
-0.456
-0.72%
1 janv. 2003
62.793
+0.094
0.15%
1 janv. 2004
64.379
+1.586
2.53%
1 janv. 2005
62.682
-1.697
-2.64%
1 janv. 2006
62.317
-0.365
-0.58%
1 janv. 2007
61.027
-1.29
-2.07%
1 janv. 2008
62.792
+1.765
2.89%
1 janv. 2009
60.752
-2.04
-3.25%
1 janv. 2010
59.739
-1.013
-1.67%
1 janv. 2011
59.457
-0.282
-0.47%
1 janv. 2012
60.401
+0.944
1.59%
1 janv. 2013
59.681
-0.72
-1.19%
1 janv. 2014
58.876
-0.805
-1.35%
1 janv. 2015
56.276
-2.601
-4.42%
Classement des pays selon les statistiques actuelles par années


Commentaires: