29
/fr/
fr
AIzaSyAYiBZKx7MnpbEhh9jyipgxe19OcubqV5w
April 1, 2024
48906
Middle East & North Africa (excluding high income)
MNA
false
2
1
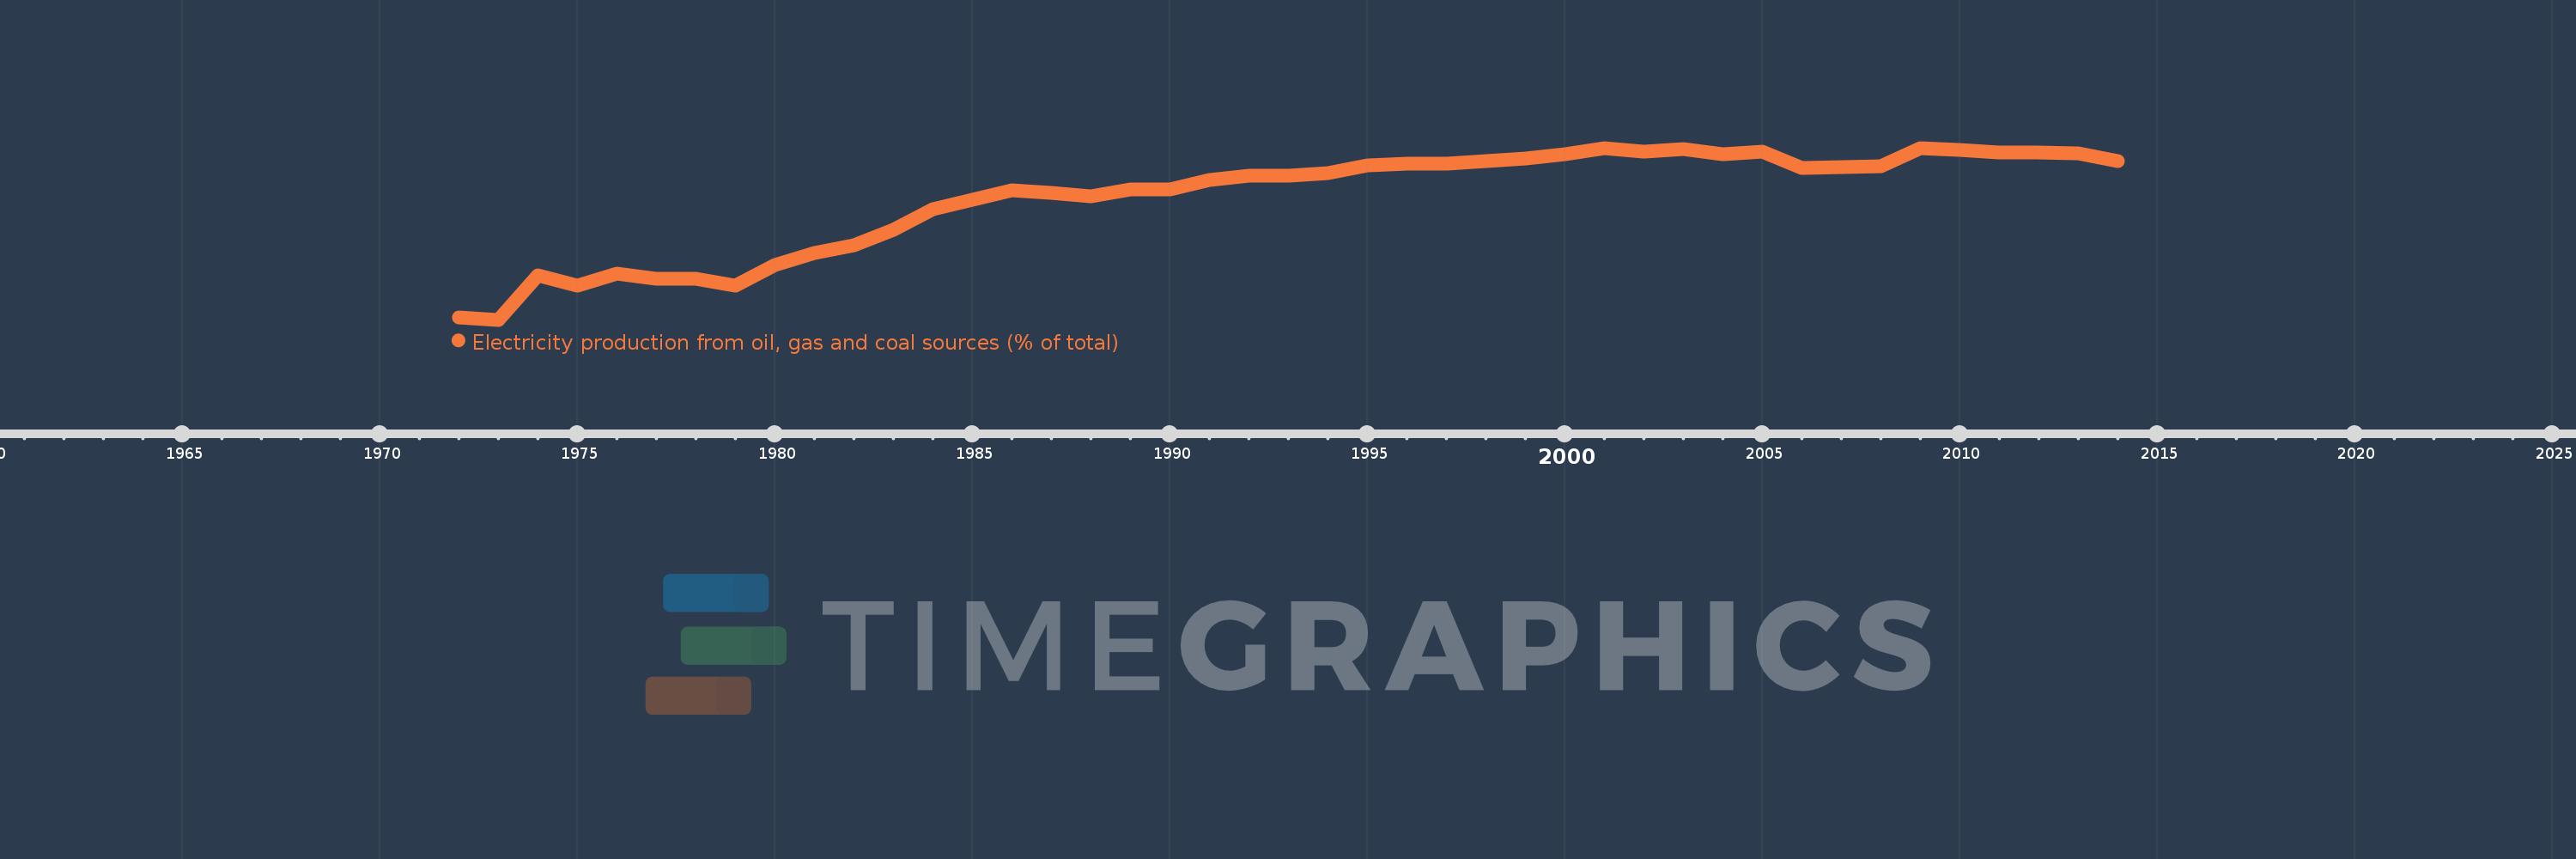
Electricity production from oil, gas and coal sources (% of total)
2014,2013,2012,2011,2010,2009,2008,2007,2006,2005,2004,2003,2002,2001,2000,1999,1998,1997,1996,1995,1994,1993,1992,1991,1990,1989,1988,1987,1986,1985,1984,1983,1982,1981,1980,1979,1978,1977,1976,1975,1974,1973,1972
Cette statistique dans les autres pays:
AlbaniaAlgeriaAngolaArab WorldArgentinaArmeniaAustraliaAustriaAzerbaijanBahrainBangladeshBelarusBelgiumBeninBoliviaBosnia and HerzegovinaBotswanaBrazilBrunei DarussalamBulgariaCambodiaCameroonCanadaCentral Europe and the BalticsChileChinaColombiaCongo, Dem. Rep.Congo, Rep.Costa RicaCote d'IvoireCroatiaCubaCuracaoCyprusCzech RepublicDenmarkDominican RepublicEarly-demographic dividendEast Asia & PacificEast Asia & Pacific (excluding high income)East Asia & Pacific (IDA & IBRD countries)EcuadorEgypt, Arab Rep.El SalvadorEritreaEstoniaEthiopiaEuro areaEurope & Central AsiaEurope & Central Asia (excluding high income)Europe & Central Asia (IDA & IBRD countries)European UnionFinlandFragile and conflict affected situationsFranceGabonGeorgiaGermanyGhanaGibraltarGreeceGuatemalaHaitiHeavily indebted poor countries (HIPC)High incomeHondurasHong Kong SAR, ChinaHungaryIBRD onlyIcelandIDA & IBRD totalIDA blendIDA onlyIDA totalIndiaIndonesiaIran, Islamic Rep.IraqIrelandIsraelItalyJamaicaJapanJordanKazakhstanKenyaKorea, Dem. People’s Rep.Korea, Rep.KosovoKuwaitKyrgyz RepublicLate-demographic dividendLatin America & Caribbean Latin America & Caribbean (excluding high income)Latin America & the Caribbean (IDA & IBRD countries)LatviaLeast developed countries: UN classificationLebanonLibyaLithuaniaLow & middle incomeLower middle incomeLuxembourgMacedonia, FYRMalaysiaMaltaMauritiusMexicoMiddle East & North AfricaMiddle East & North Africa (excluding high income)Middle East & North Africa (IDA & IBRD countries)Middle incomeMoldovaMongoliaMontenegroMoroccoMozambiqueMyanmarNamibiaNepalNetherlandsNew ZealandNicaraguaNigerNigeriaNorth AmericaNorwayOECD membersOmanOther small statesPakistanPanamaParaguayPeruPhilippinesPolandPortugalPost-demographic dividendPre-demographic dividendQatarRomaniaRussian FederationSaudi ArabiaSenegalSerbiaSingaporeSlovak RepublicSloveniaSmall statesSouth AfricaSouth AsiaSouth Asia (IDA & IBRD)South SudanSpainSri LankaSub-Saharan Africa Sub-Saharan Africa (excluding high income)Sub-Saharan Africa (IDA & IBRD countries)SudanSwedenSwitzerlandSyrian Arab RepublicTajikistanTanzaniaThailandTogoTrinidad and TobagoTunisiaTurkeyTurkmenistanUkraineUnited Arab EmiratesUnited KingdomUnited StatesUpper middle incomeUruguayUzbekistanVenezuela, RBVietnamWorldYemen, Rep.ZambiaZimbabwe La ligne de temps
Cette échelle de temps montre un graphique de 1972 année à 2014 année Middle East & North Africa (excluding high income). Les données jusqu'à 1971 année ne sont pas présentés. Quantité d'observations actuelles selon dates: 43.
Source (désignation):
Les indicateurs du développement mondiale
Source (organisation):
IEA Statistics © OECD/IEA 2014 (http://www.iea.org/stats/index.asp), subject to https://www.iea.org/t&c/termsandconditions/
Catégories:
Energy & Mining, Environment
Dernière mise à jour
23 avr. 2017
Les indicateurs de changement de valeurs selon les années
Minimum:
60.801
1 janv. 1973
Maximum:
92.754
1 janv. 2009
Pour la date d''observation
Valeur
Changement absolu
Le changement par rapport à la valeur précédente
1 janv. 1972
61.299
+61.299
0.0%
1 janv. 1973
60.801
-0.499
-0.81%
1 janv. 1974
69.021
+8.22
13.52%
1 janv. 1975
67.217
-1.804
-2.61%
1 janv. 1976
69.339
+2.122
3.16%
1 janv. 1977
68.49
-0.849
-1.22%
1 janv. 1978
68.376
-0.114
-0.17%
1 janv. 1979
67.08
-1.296
-1.9%
1 janv. 1980
70.957
+3.877
5.78%
1 janv. 1981
73.154
+2.197
3.1%
1 janv. 1982
74.671
+1.517
2.07%
1 janv. 1983
77.456
+2.784
3.73%
1 janv. 1984
81.358
+3.902
5.04%
1 janv. 1985
83.116
+1.758
2.16%
1 janv. 1986
84.84
+1.725
2.08%
1 janv. 1987
84.409
-0.432
-0.51%
1 janv. 1988
83.705
-0.704
-0.83%
1 janv. 1989
85.102
+1.398
1.67%
1 janv. 1990
85.085
-0.017
-0.02%
1 janv. 1991
86.805
+1.72
2.02%
1 janv. 1992
87.565
+0.76
0.88%
1 janv. 1993
87.531
-0.035
-0.04%
1 janv. 1994
88.021
+0.49
0.56%
1 janv. 1995
89.442
+1.421
1.61%
1 janv. 1996
89.883
+0.442
0.49%
1 janv. 1997
89.8
-0.084
-0.09%
1 janv. 1998
90.305
+0.506
0.56%
1 janv. 1999
90.759
+0.454
0.5%
1 janv. 2000
91.611
+0.852
0.94%
1 janv. 2001
92.628
+1.017
1.11%
1 janv. 2002
92.116
-0.512
-0.55%
1 janv. 2003
92.585
+0.469
0.51%
1 janv. 2004
91.65
-0.935
-1.01%
1 janv. 2005
92.034
+0.384
0.42%
1 janv. 2006
89.05
-2.984
-3.24%
1 janv. 2007
89.151
+0.102
0.11%
1 janv. 2008
89.354
+0.203
0.23%
1 janv. 2009
92.754
+3.4
3.81%
1 janv. 2010
92.37
-0.384
-0.41%
1 janv. 2011
91.877
-0.493
-0.53%
1 janv. 2012
91.86
-0.017
-0.02%
1 janv. 2013
91.729
-0.131
-0.14%
1 janv. 2014
90.385
-1.344
-1.47%
Classement des pays selon les statistiques actuelles par années


Commentaires: