29
/fr/
fr
AIzaSyAYiBZKx7MnpbEhh9jyipgxe19OcubqV5w
April 1, 2024
76835
Bahrain
BHR
true
2
1
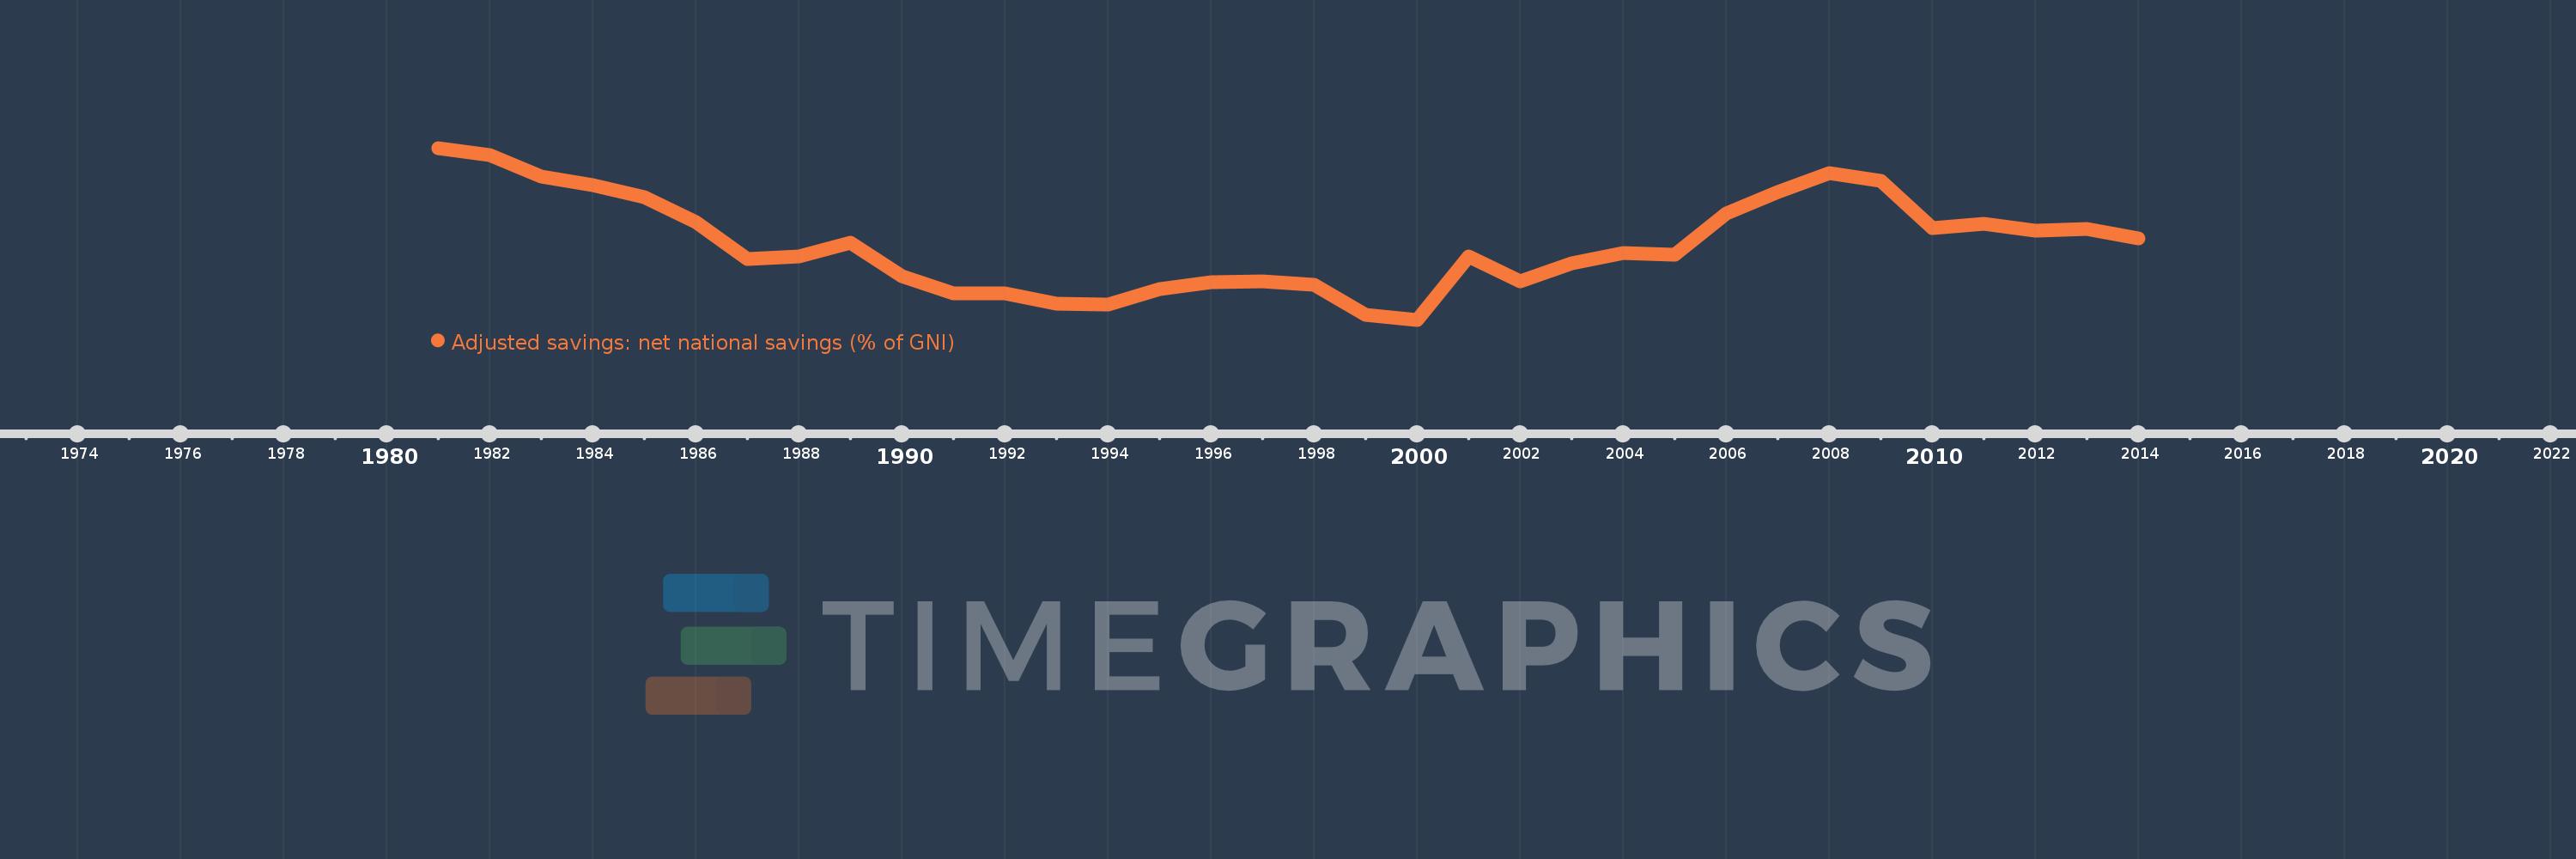
Adjusted savings: net national savings (% of GNI)
2014,2013,2012,2011,2010,2009,2008,2007,2006,2005,2004,2003,2002,2001,2000,1999,1998,1997,1996,1995,1994,1993,1992,1991,1990,1989,1988,1987,1986,1985,1984,1983,1982,1981
Cette statistique dans les autres pays:
AfghanistanAlbaniaAlgeriaAngolaAntigua and BarbudaArab WorldArgentinaArmeniaAustraliaAustriaAzerbaijanBahamas, TheBahrainBangladeshBarbadosBelarusBelgiumBelizeBeninBermudaBhutanBoliviaBosnia and HerzegovinaBotswanaBrazilBrunei DarussalamBulgariaBurkina FasoBurundiCabo VerdeCambodiaCameroonCanadaCaribbean small statesCentral African RepublicCentral Europe and the BalticsChadChileChinaColombiaComorosCongo, Dem. Rep.Congo, Rep.Costa RicaCote d'IvoireCroatiaCyprusCzech RepublicDenmarkDjiboutiDominicaDominican RepublicEarly-demographic dividendEast Asia & PacificEast Asia & Pacific (excluding high income)East Asia & Pacific (IDA & IBRD countries)EcuadorEgypt, Arab Rep.El SalvadorEquatorial GuineaEritreaEstoniaEthiopiaEuro areaEurope & Central AsiaEurope & Central Asia (excluding high income)Europe & Central Asia (IDA & IBRD countries)European UnionFijiFinlandFragile and conflict affected situationsFranceGabonGambia, TheGeorgiaGermanyGhanaGreeceGrenadaGuatemalaGuineaGuinea-BissauGuyanaHaitiHeavily indebted poor countries (HIPC)High incomeHondurasHong Kong SAR, ChinaHungaryIBRD onlyIcelandIDA & IBRD totalIDA blendIDA onlyIDA totalIndiaIndonesiaIran, Islamic Rep.IraqIrelandIsraelItalyJamaicaJapanJordanKazakhstanKenyaKiribatiKorea, Rep.KosovoKuwaitKyrgyz RepublicLao PDRLate-demographic dividendLatin America & Caribbean Latin America & Caribbean (excluding high income)Latin America & the Caribbean (IDA & IBRD countries)LatviaLeast developed countries: UN classificationLebanonLesothoLiberiaLibyaLithuaniaLow & middle incomeLow incomeLower middle incomeLuxembourgMacao SAR, ChinaMacedonia, FYRMadagascarMalawiMalaysiaMaldivesMaliMaltaMauritaniaMauritiusMexicoMiddle East & North AfricaMiddle East & North Africa (excluding high income)Middle East & North Africa (IDA & IBRD countries)Middle incomeMoldovaMongoliaMontenegroMoroccoMozambiqueNamibiaNepalNetherlandsNew ZealandNicaraguaNigerNigeriaNorth AmericaNorwayOECD membersOmanOther small statesPacific island small statesPakistanPanamaPapua New GuineaParaguayPeruPhilippinesPolandPortugalPost-demographic dividendPre-demographic dividendQatarRomaniaRussian FederationRwandaSaudi ArabiaSenegalSerbiaSeychellesSierra LeoneSingaporeSlovak RepublicSloveniaSmall statesSolomon IslandsSouth AfricaSouth AsiaSouth Asia (IDA & IBRD)SpainSri LankaSt. Kitts and NevisSt. LuciaSt. Vincent and the GrenadinesSub-Saharan Africa Sub-Saharan Africa (excluding high income)Sub-Saharan Africa (IDA & IBRD countries)SudanSurinameSwazilandSwedenSwitzerlandSyrian Arab RepublicTajikistanTanzaniaThailandTimor-LesteTogoTongaTrinidad and TobagoTunisiaTurkeyTurkmenistanUgandaUkraineUnited KingdomUnited StatesUpper middle incomeUruguayVanuatuVenezuela, RBVietnamWest Bank and GazaWorldYemen, Rep.ZambiaZimbabwe La ligne de temps
Cette échelle de temps montre un graphique de 1981 année à 2014 année Bahrain. Les données jusqu'à 1980 année ne sont pas présentés. Quantité d'observations actuelles selon dates: 34.
Source (désignation):
Les indicateurs du développement mondiale
Source (organisation):
World Bank staff estimates based on sources and methods in World Bank's "The Changing Wealth of Nations: Measuring Sustainable Development in the New Millennium" (2011).
Catégories:
Economy & Growth, Environment
Dernière mise à jour
23 avr. 2017
Les indicateurs de changement de valeurs selon les années
Minimum:
-2.921
1 janv. 2000
Maximum:
50.697
1 janv. 1981
Pour la date d''observation
Valeur
Changement absolu
Le changement par rapport à la valeur précédente
1 janv. 1981
50.697
+50.697
0.0%
1 janv. 1982
48.455
-2.242
-4.42%
1 janv. 1983
41.673
-6.782
-14.0%
1 janv. 1984
39.179
-2.494
-5.99%
1 janv. 1985
35.276
-3.903
-9.96%
1 janv. 1986
27.686
-7.59
-21.52%
1 janv. 1987
16.002
-11.683
-42.2%
1 janv. 1988
16.799
+0.797
4.98%
1 janv. 1989
21.195
+4.396
26.17%
1 janv. 1990
10.741
-10.454
-49.32%
1 janv. 1991
5.249
-5.493
-51.14%
1 janv. 1992
5.2
-0.049
-0.93%
1 janv. 1993
2.126
-3.074
-59.12%
1 janv. 1994
1.836
-0.289
-13.62%
1 janv. 1995
6.755
+4.919
267.89%
1 janv. 1996
8.676
+1.921
28.43%
1 janv. 1997
8.951
+0.275
3.17%
1 janv. 1998
7.964
-0.986
-11.02%
1 janv. 1999
-1.279
-9.244
-116.06%
1 janv. 2000
-2.921
-1.642
128.34%
1 janv. 2001
16.948
+19.869
-680.14%
1 janv. 2002
8.956
-7.992
-47.16%
1 janv. 2003
14.62
+5.665
63.25%
1 janv. 2004
17.959
+3.339
22.84%
1 janv. 2005
17.306
-0.653
-3.64%
1 janv. 2006
30.342
+13.036
75.33%
1 janv. 2007
36.85
+6.508
21.45%
1 janv. 2008
42.837
+5.987
16.25%
1 janv. 2009
40.421
-2.416
-5.64%
1 janv. 2010
25.584
-14.837
-36.71%
1 janv. 2011
27.11
+1.526
5.96%
1 janv. 2012
24.995
-2.115
-7.8%
1 janv. 2013
25.354
+0.359
1.43%
1 janv. 2014
22.535
-2.819
-11.12%
Classement des pays selon les statistiques actuelles par années


Commentaires: