29
/fr/
fr
AIzaSyAYiBZKx7MnpbEhh9jyipgxe19OcubqV5w
April 1, 2024
27053
East Asia & Pacific
EAS
false
2
1
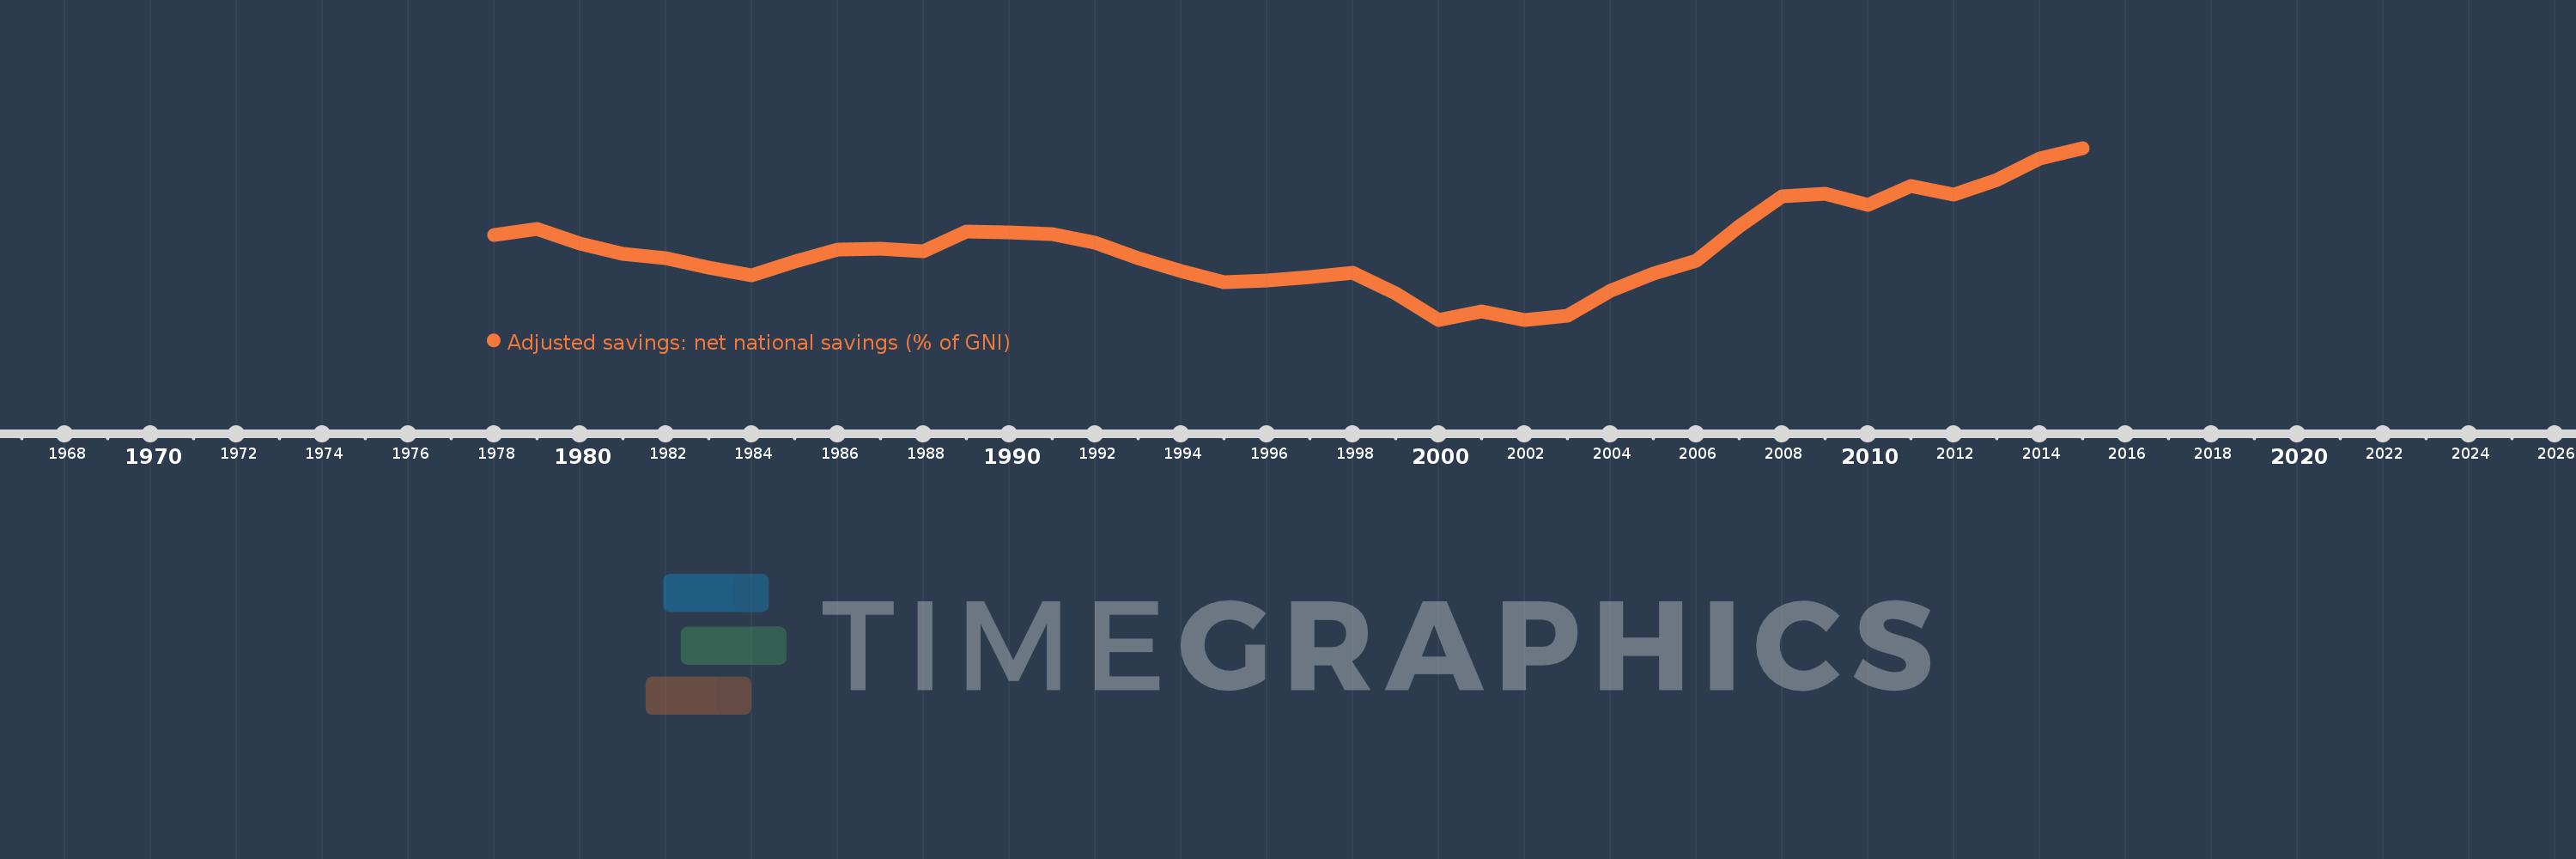
Adjusted savings: net national savings (% of GNI)
2015,2014,2013,2012,2011,2010,2009,2008,2007,2006,2005,2004,2003,2002,2001,2000,1999,1998,1997,1996,1995,1994,1993,1992,1991,1990,1989,1988,1987,1986,1985,1984,1983,1982,1981,1980,1979,1978
Cette statistique dans les autres pays:
AfghanistanAlbaniaAlgeriaAngolaAntigua and BarbudaArab WorldArgentinaArmeniaAustraliaAustriaAzerbaijanBahamas, TheBahrainBangladeshBarbadosBelarusBelgiumBelizeBeninBermudaBhutanBoliviaBosnia and HerzegovinaBotswanaBrazilBrunei DarussalamBulgariaBurkina FasoBurundiCabo VerdeCambodiaCameroonCanadaCaribbean small statesCentral African RepublicCentral Europe and the BalticsChadChileChinaColombiaComorosCongo, Dem. Rep.Congo, Rep.Costa RicaCote d'IvoireCroatiaCyprusCzech RepublicDenmarkDjiboutiDominicaDominican RepublicEarly-demographic dividendEast Asia & PacificEast Asia & Pacific (excluding high income)East Asia & Pacific (IDA & IBRD countries)EcuadorEgypt, Arab Rep.El SalvadorEquatorial GuineaEritreaEstoniaEthiopiaEuro areaEurope & Central AsiaEurope & Central Asia (excluding high income)Europe & Central Asia (IDA & IBRD countries)European UnionFijiFinlandFragile and conflict affected situationsFranceGabonGambia, TheGeorgiaGermanyGhanaGreeceGrenadaGuatemalaGuineaGuinea-BissauGuyanaHaitiHeavily indebted poor countries (HIPC)High incomeHondurasHong Kong SAR, ChinaHungaryIBRD onlyIcelandIDA & IBRD totalIDA blendIDA onlyIDA totalIndiaIndonesiaIran, Islamic Rep.IraqIrelandIsraelItalyJamaicaJapanJordanKazakhstanKenyaKiribatiKorea, Rep.KosovoKuwaitKyrgyz RepublicLao PDRLate-demographic dividendLatin America & Caribbean Latin America & Caribbean (excluding high income)Latin America & the Caribbean (IDA & IBRD countries)LatviaLeast developed countries: UN classificationLebanonLesothoLiberiaLibyaLithuaniaLow & middle incomeLow incomeLower middle incomeLuxembourgMacao SAR, ChinaMacedonia, FYRMadagascarMalawiMalaysiaMaldivesMaliMaltaMauritaniaMauritiusMexicoMiddle East & North AfricaMiddle East & North Africa (excluding high income)Middle East & North Africa (IDA & IBRD countries)Middle incomeMoldovaMongoliaMontenegroMoroccoMozambiqueNamibiaNepalNetherlandsNew ZealandNicaraguaNigerNigeriaNorth AmericaNorwayOECD membersOmanOther small statesPacific island small statesPakistanPanamaPapua New GuineaParaguayPeruPhilippinesPolandPortugalPost-demographic dividendPre-demographic dividendQatarRomaniaRussian FederationRwandaSaudi ArabiaSenegalSerbiaSeychellesSierra LeoneSingaporeSlovak RepublicSloveniaSmall statesSolomon IslandsSouth AfricaSouth AsiaSouth Asia (IDA & IBRD)SpainSri LankaSt. Kitts and NevisSt. LuciaSt. Vincent and the GrenadinesSub-Saharan Africa Sub-Saharan Africa (excluding high income)Sub-Saharan Africa (IDA & IBRD countries)SudanSurinameSwazilandSwedenSwitzerlandSyrian Arab RepublicTajikistanTanzaniaThailandTimor-LesteTogoTongaTrinidad and TobagoTunisiaTurkeyTurkmenistanUgandaUkraineUnited KingdomUnited StatesUpper middle incomeUruguayVanuatuVenezuela, RBVietnamWest Bank and GazaWorldYemen, Rep.ZambiaZimbabwe La ligne de temps
Cette échelle de temps montre un graphique de 1978 année à 2015 année East Asia & Pacific. Les données jusqu'à 1977 année ne sont pas présentés. Quantité d'observations actuelles selon dates: 38.
Source (désignation):
Les indicateurs du développement mondiale
Source (organisation):
World Bank staff estimates based on sources and methods in World Bank's "The Changing Wealth of Nations: Measuring Sustainable Development in the New Millennium" (2011).
Catégories:
Economy & Growth, Environment
Dernière mise à jour
23 avr. 2017
Les indicateurs de changement de valeurs selon les années
Minimum:
11.602
1 janv. 2002
Maximum:
22.768
1 janv. 2015
Pour la date d''observation
Valeur
Changement absolu
Le changement par rapport à la valeur précédente
1 janv. 1978
17.14
+17.14
0.0%
1 janv. 1979
17.487
+0.347
2.03%
1 janv. 1980
16.527
-0.96
-5.49%
1 janv. 1981
15.872
-0.656
-3.97%
1 janv. 1982
15.629
-0.243
-1.53%
1 janv. 1983
14.976
-0.653
-4.18%
1 janv. 1984
14.499
-0.477
-3.19%
1 janv. 1985
15.38
+0.882
6.08%
1 janv. 1986
16.139
+0.759
4.93%
1 janv. 1987
16.21
+0.071
0.44%
1 janv. 1988
16.073
-0.137
-0.84%
1 janv. 1989
17.329
+1.256
7.81%
1 janv. 1990
17.255
-0.074
-0.42%
1 janv. 1991
17.195
-0.061
-0.35%
1 janv. 1992
16.624
-0.57
-3.32%
1 janv. 1993
15.608
-1.016
-6.11%
1 janv. 1994
14.755
-0.853
-5.47%
1 janv. 1995
14.05
-0.705
-4.78%
1 janv. 1996
14.138
+0.087
0.62%
1 janv. 1997
14.381
+0.244
1.72%
1 janv. 1998
14.681
+0.3
2.09%
1 janv. 1999
13.289
-1.393
-9.49%
1 janv. 2000
11.603
-1.686
-12.69%
1 janv. 2001
12.129
+0.526
4.54%
1 janv. 2002
11.602
-0.528
-4.35%
1 janv. 2003
11.875
+0.274
2.36%
1 janv. 2004
13.462
+1.587
13.36%
1 janv. 2005
14.617
+1.154
8.58%
1 janv. 2006
15.411
+0.794
5.43%
1 janv. 2007
17.682
+2.271
14.74%
1 janv. 2008
19.624
+1.942
10.98%
1 janv. 2009
19.802
+0.177
0.9%
1 janv. 2010
19.059
-0.742
-3.75%
1 janv. 2011
20.278
+1.219
6.39%
1 janv. 2012
19.71
-0.568
-2.8%
1 janv. 2013
20.672
+0.962
4.88%
1 janv. 2014
22.083
+1.41
6.82%
1 janv. 2015
22.768
+0.686
3.11%
Classement des pays selon les statistiques actuelles par années


Commentaires: