29
/fr/
fr
AIzaSyAYiBZKx7MnpbEhh9jyipgxe19OcubqV5w
April 1, 2024
206359
Nepal
NPL
true
2
1
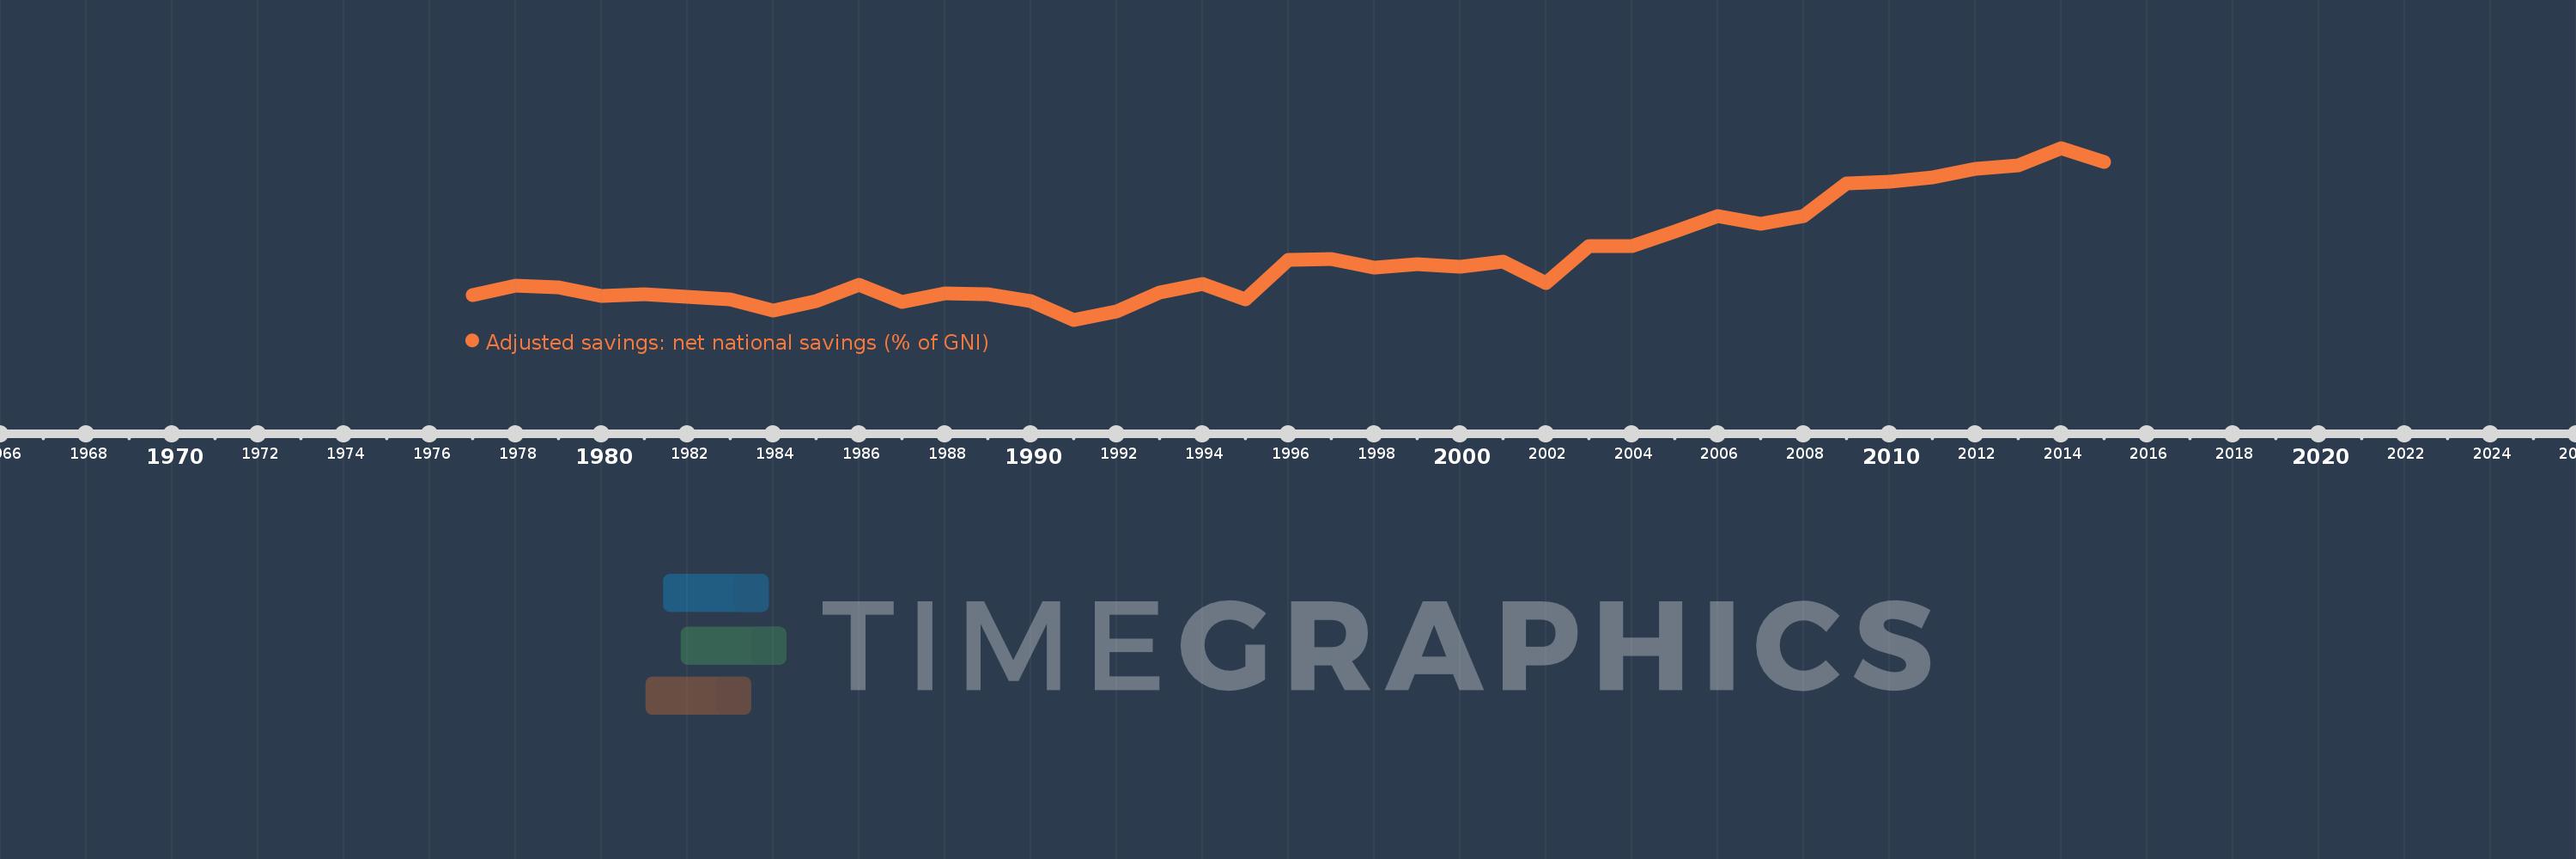
Adjusted savings: net national savings (% of GNI)
2015,2014,2013,2012,2011,2010,2009,2008,2007,2006,2005,2004,2003,2002,2001,2000,1999,1998,1997,1996,1995,1994,1993,1992,1991,1990,1989,1988,1987,1986,1985,1984,1983,1982,1981,1980,1979,1978,1977
Cette statistique dans les autres pays:
AfghanistanAlbaniaAlgeriaAngolaAntigua and BarbudaArab WorldArgentinaArmeniaAustraliaAustriaAzerbaijanBahamas, TheBahrainBangladeshBarbadosBelarusBelgiumBelizeBeninBermudaBhutanBoliviaBosnia and HerzegovinaBotswanaBrazilBrunei DarussalamBulgariaBurkina FasoBurundiCabo VerdeCambodiaCameroonCanadaCaribbean small statesCentral African RepublicCentral Europe and the BalticsChadChileChinaColombiaComorosCongo, Dem. Rep.Congo, Rep.Costa RicaCote d'IvoireCroatiaCyprusCzech RepublicDenmarkDjiboutiDominicaDominican RepublicEarly-demographic dividendEast Asia & PacificEast Asia & Pacific (excluding high income)East Asia & Pacific (IDA & IBRD countries)EcuadorEgypt, Arab Rep.El SalvadorEquatorial GuineaEritreaEstoniaEthiopiaEuro areaEurope & Central AsiaEurope & Central Asia (excluding high income)Europe & Central Asia (IDA & IBRD countries)European UnionFijiFinlandFragile and conflict affected situationsFranceGabonGambia, TheGeorgiaGermanyGhanaGreeceGrenadaGuatemalaGuineaGuinea-BissauGuyanaHaitiHeavily indebted poor countries (HIPC)High incomeHondurasHong Kong SAR, ChinaHungaryIBRD onlyIcelandIDA & IBRD totalIDA blendIDA onlyIDA totalIndiaIndonesiaIran, Islamic Rep.IraqIrelandIsraelItalyJamaicaJapanJordanKazakhstanKenyaKiribatiKorea, Rep.KosovoKuwaitKyrgyz RepublicLao PDRLate-demographic dividendLatin America & Caribbean Latin America & Caribbean (excluding high income)Latin America & the Caribbean (IDA & IBRD countries)LatviaLeast developed countries: UN classificationLebanonLesothoLiberiaLibyaLithuaniaLow & middle incomeLow incomeLower middle incomeLuxembourgMacao SAR, ChinaMacedonia, FYRMadagascarMalawiMalaysiaMaldivesMaliMaltaMauritaniaMauritiusMexicoMiddle East & North AfricaMiddle East & North Africa (excluding high income)Middle East & North Africa (IDA & IBRD countries)Middle incomeMoldovaMongoliaMontenegroMoroccoMozambiqueNamibiaNepalNetherlandsNew ZealandNicaraguaNigerNigeriaNorth AmericaNorwayOECD membersOmanOther small statesPacific island small statesPakistanPanamaPapua New GuineaParaguayPeruPhilippinesPolandPortugalPost-demographic dividendPre-demographic dividendQatarRomaniaRussian FederationRwandaSaudi ArabiaSenegalSerbiaSeychellesSierra LeoneSingaporeSlovak RepublicSloveniaSmall statesSolomon IslandsSouth AfricaSouth AsiaSouth Asia (IDA & IBRD)SpainSri LankaSt. Kitts and NevisSt. LuciaSt. Vincent and the GrenadinesSub-Saharan Africa Sub-Saharan Africa (excluding high income)Sub-Saharan Africa (IDA & IBRD countries)SudanSurinameSwazilandSwedenSwitzerlandSyrian Arab RepublicTajikistanTanzaniaThailandTimor-LesteTogoTongaTrinidad and TobagoTunisiaTurkeyTurkmenistanUgandaUkraineUnited KingdomUnited StatesUpper middle incomeUruguayVanuatuVenezuela, RBVietnamWest Bank and GazaWorldYemen, Rep.ZambiaZimbabwe La ligne de temps
Cette échelle de temps montre un graphique de 1977 année à 2015 année Nepal. Les données jusqu'à 1976 année ne sont pas présentés. Quantité d'observations actuelles selon dates: 39.
Source (désignation):
Les indicateurs du développement mondiale
Source (organisation):
World Bank staff estimates based on sources and methods in World Bank's "The Changing Wealth of Nations: Measuring Sustainable Development in the New Millennium" (2011).
Catégories:
Economy & Growth, Environment
Dernière mise à jour
23 avr. 2017
Les indicateurs de changement de valeurs selon les années
Minimum:
8.261
1 janv. 1991
Maximum:
37.487
1 janv. 2014
Pour la date d''observation
Valeur
Changement absolu
Le changement par rapport à la valeur précédente
1 janv. 1977
12.502
+12.502
0.0%
1 janv. 1978
14.126
+1.624
12.99%
1 janv. 1979
13.827
-0.299
-2.12%
1 janv. 1980
12.336
-1.491
-10.78%
1 janv. 1981
12.544
+0.207
1.68%
1 janv. 1982
12.139
-0.404
-3.22%
1 janv. 1983
11.736
-0.404
-3.33%
1 janv. 1984
9.764
-1.972
-16.8%
1 janv. 1985
11.394
+1.63
16.7%
1 janv. 1986
14.211
+2.817
24.72%
1 janv. 1987
11.237
-2.974
-20.93%
1 janv. 1988
12.698
+1.461
13.0%
1 janv. 1989
12.605
-0.092
-0.73%
1 janv. 1990
11.369
-1.236
-9.81%
1 janv. 1991
8.261
-3.108
-27.34%
1 janv. 1992
9.715
+1.454
17.6%
1 janv. 1993
12.913
+3.198
32.92%
1 janv. 1994
14.366
+1.452
11.25%
1 janv. 1995
11.767
-2.598
-18.09%
1 janv. 1996
18.411
+6.644
56.46%
1 janv. 1997
18.56
+0.148
0.81%
1 janv. 1998
17.066
-1.494
-8.05%
1 janv. 1999
17.721
+0.655
3.84%
1 janv. 2000
17.249
-0.473
-2.67%
1 janv. 2001
18.201
+0.953
5.52%
1 janv. 2002
14.559
-3.642
-20.01%
1 janv. 2003
20.821
+6.261
43.0%
1 janv. 2004
20.734
-0.086
-0.41%
1 janv. 2005
23.2
+2.466
11.89%
1 janv. 2006
25.965
+2.765
11.92%
1 janv. 2007
24.569
-1.396
-5.38%
1 janv. 2008
25.826
+1.257
5.12%
1 janv. 2009
31.38
+5.554
21.5%
1 janv. 2010
31.791
+0.411
1.31%
1 janv. 2011
32.461
+0.67
2.11%
1 janv. 2012
33.985
+1.524
4.69%
1 janv. 2013
34.542
+0.557
1.64%
1 janv. 2014
37.487
+2.945
8.53%
1 janv. 2015
35.037
-2.45
-6.54%
Classement des pays selon les statistiques actuelles par années


Commentaires: