29
/fr/
fr
AIzaSyAYiBZKx7MnpbEhh9jyipgxe19OcubqV5w
April 1, 2024
280572
Venezuela, RB
VEN
true
2
1
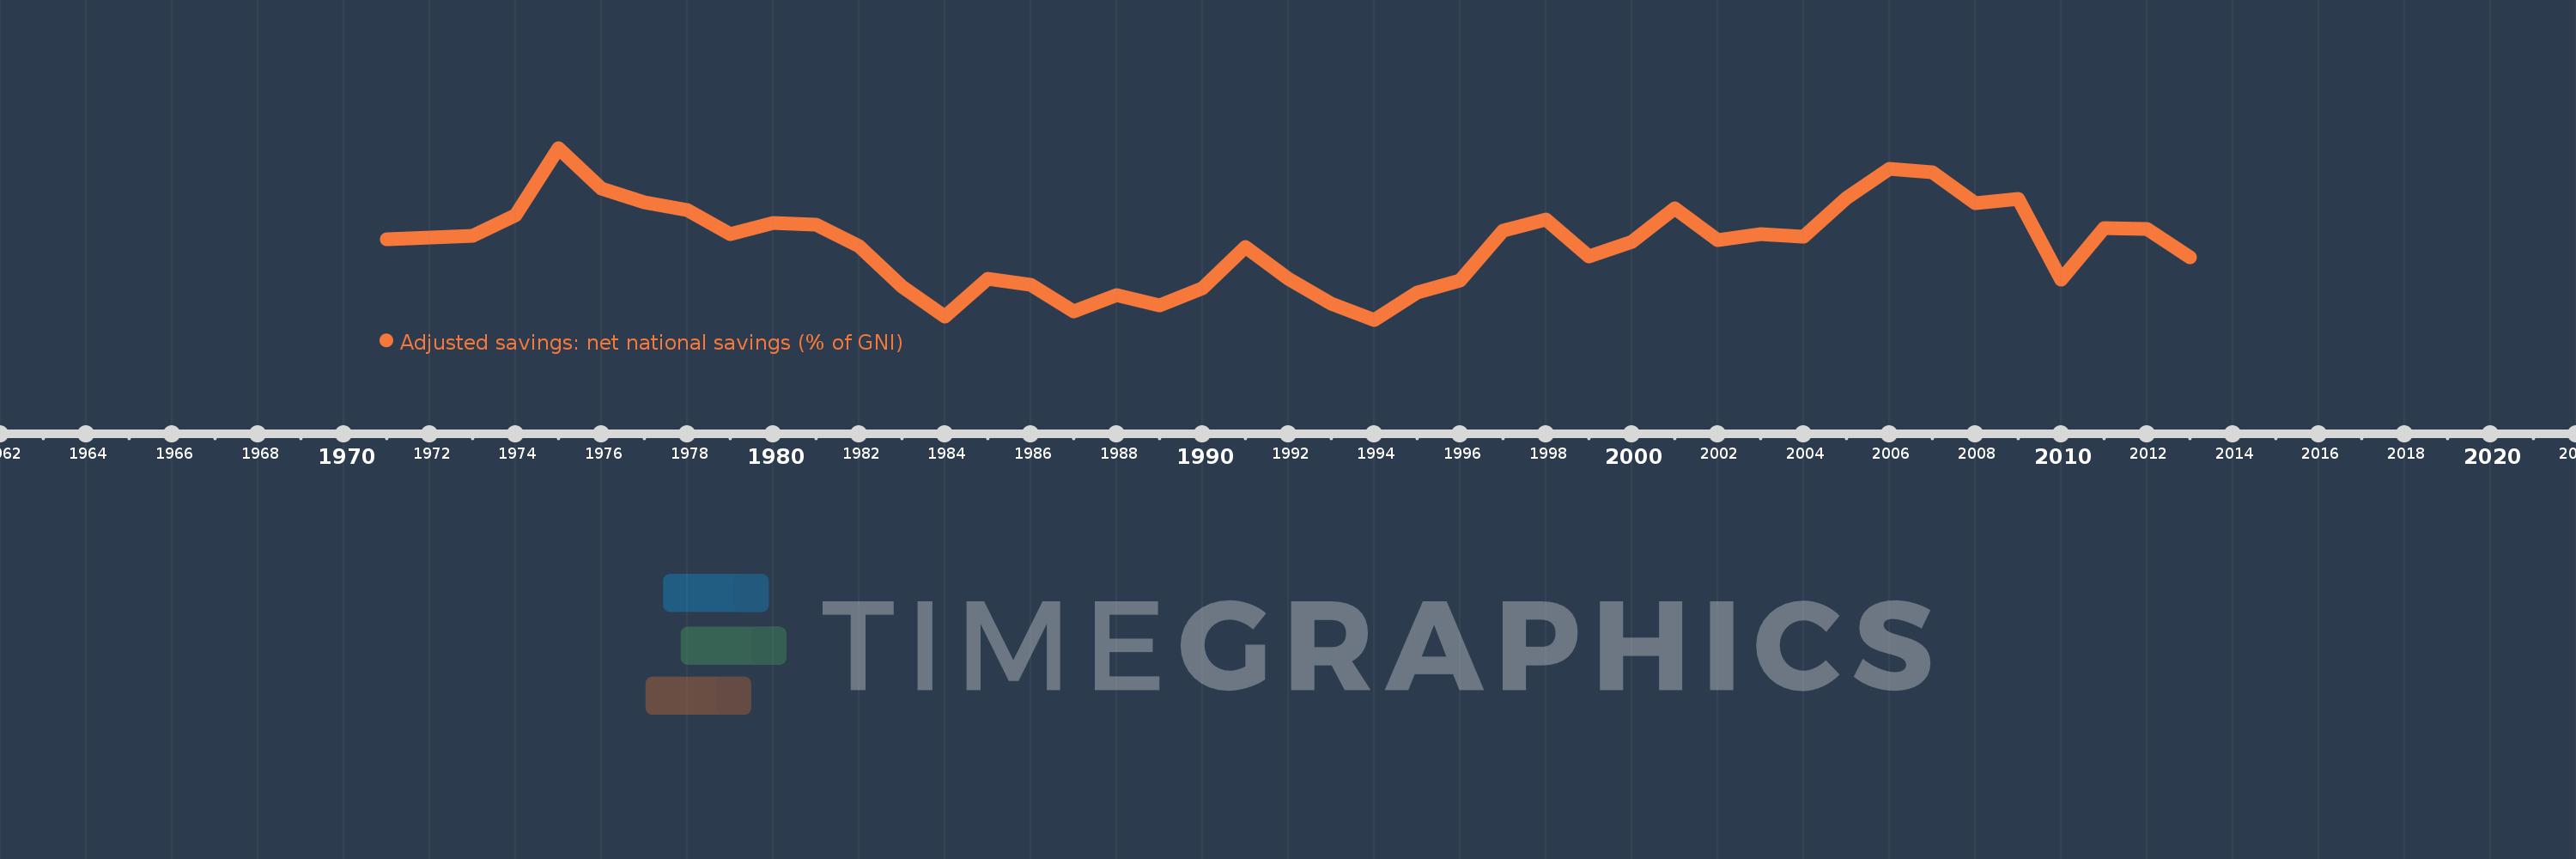
Adjusted savings: net national savings (% of GNI)
2013,2012,2011,2010,2009,2008,2007,2006,2005,2004,2003,2002,2001,2000,1999,1998,1997,1996,1995,1994,1993,1992,1991,1990,1989,1988,1987,1986,1985,1984,1983,1982,1981,1980,1979,1978,1977,1976,1975,1974,1973,1972,1971
Cette statistique dans les autres pays:
AfghanistanAlbaniaAlgeriaAngolaAntigua and BarbudaArab WorldArgentinaArmeniaAustraliaAustriaAzerbaijanBahamas, TheBahrainBangladeshBarbadosBelarusBelgiumBelizeBeninBermudaBhutanBoliviaBosnia and HerzegovinaBotswanaBrazilBrunei DarussalamBulgariaBurkina FasoBurundiCabo VerdeCambodiaCameroonCanadaCaribbean small statesCentral African RepublicCentral Europe and the BalticsChadChileChinaColombiaComorosCongo, Dem. Rep.Congo, Rep.Costa RicaCote d'IvoireCroatiaCyprusCzech RepublicDenmarkDjiboutiDominicaDominican RepublicEarly-demographic dividendEast Asia & PacificEast Asia & Pacific (excluding high income)East Asia & Pacific (IDA & IBRD countries)EcuadorEgypt, Arab Rep.El SalvadorEquatorial GuineaEritreaEstoniaEthiopiaEuro areaEurope & Central AsiaEurope & Central Asia (excluding high income)Europe & Central Asia (IDA & IBRD countries)European UnionFijiFinlandFragile and conflict affected situationsFranceGabonGambia, TheGeorgiaGermanyGhanaGreeceGrenadaGuatemalaGuineaGuinea-BissauGuyanaHaitiHeavily indebted poor countries (HIPC)High incomeHondurasHong Kong SAR, ChinaHungaryIBRD onlyIcelandIDA & IBRD totalIDA blendIDA onlyIDA totalIndiaIndonesiaIran, Islamic Rep.IraqIrelandIsraelItalyJamaicaJapanJordanKazakhstanKenyaKiribatiKorea, Rep.KosovoKuwaitKyrgyz RepublicLao PDRLate-demographic dividendLatin America & Caribbean Latin America & Caribbean (excluding high income)Latin America & the Caribbean (IDA & IBRD countries)LatviaLeast developed countries: UN classificationLebanonLesothoLiberiaLibyaLithuaniaLow & middle incomeLow incomeLower middle incomeLuxembourgMacao SAR, ChinaMacedonia, FYRMadagascarMalawiMalaysiaMaldivesMaliMaltaMauritaniaMauritiusMexicoMiddle East & North AfricaMiddle East & North Africa (excluding high income)Middle East & North Africa (IDA & IBRD countries)Middle incomeMoldovaMongoliaMontenegroMoroccoMozambiqueNamibiaNepalNetherlandsNew ZealandNicaraguaNigerNigeriaNorth AmericaNorwayOECD membersOmanOther small statesPacific island small statesPakistanPanamaPapua New GuineaParaguayPeruPhilippinesPolandPortugalPost-demographic dividendPre-demographic dividendQatarRomaniaRussian FederationRwandaSaudi ArabiaSenegalSerbiaSeychellesSierra LeoneSingaporeSlovak RepublicSloveniaSmall statesSolomon IslandsSouth AfricaSouth AsiaSouth Asia (IDA & IBRD)SpainSri LankaSt. Kitts and NevisSt. LuciaSt. Vincent and the GrenadinesSub-Saharan Africa Sub-Saharan Africa (excluding high income)Sub-Saharan Africa (IDA & IBRD countries)SudanSurinameSwazilandSwedenSwitzerlandSyrian Arab RepublicTajikistanTanzaniaThailandTimor-LesteTogoTongaTrinidad and TobagoTunisiaTurkeyTurkmenistanUgandaUkraineUnited KingdomUnited StatesUpper middle incomeUruguayVanuatuVenezuela, RBVietnamWest Bank and GazaWorldYemen, Rep.ZambiaZimbabwe La ligne de temps
Cette échelle de temps montre un graphique de 1971 année à 2013 année Venezuela, RB. Les données jusqu'à 1970 année ne sont pas présentés. Quantité d'observations actuelles selon dates: 43.
Source (désignation):
Les indicateurs du développement mondiale
Source (organisation):
World Bank staff estimates based on sources and methods in World Bank's "The Changing Wealth of Nations: Measuring Sustainable Development in the New Millennium" (2011).
Catégories:
Economy & Growth, Environment
Dernière mise à jour
23 avr. 2017
Les indicateurs de changement de valeurs selon les années
Minimum:
8.853
1 janv. 1994
Maximum:
40.186
1 janv. 1975
Pour la date d''observation
Valeur
Changement absolu
Le changement par rapport à la valeur précédente
1 janv. 1971
23.53
+23.53
0.0%
1 janv. 1972
23.912
+0.382
1.62%
1 janv. 1973
24.192
+0.28
1.17%
1 janv. 1974
27.985
+3.793
15.68%
1 janv. 1975
40.186
+12.201
43.6%
1 janv. 1976
32.833
-7.353
-18.3%
1 janv. 1977
30.191
-2.641
-8.05%
1 janv. 1978
28.859
-1.332
-4.41%
1 janv. 1979
24.428
-4.431
-15.35%
1 janv. 1980
26.451
+2.022
8.28%
1 janv. 1981
26.18
-0.271
-1.02%
1 janv. 1982
22.291
-3.889
-14.85%
1 janv. 1983
14.96
-7.331
-32.89%
1 janv. 1984
9.386
-5.574
-37.26%
1 janv. 1985
16.363
+6.977
74.33%
1 janv. 1986
15.177
-1.186
-7.25%
1 janv. 1987
10.298
-4.879
-32.15%
1 janv. 1988
13.275
+2.977
28.91%
1 janv. 1989
11.475
-1.8
-13.56%
1 janv. 1990
14.675
+3.199
27.88%
1 janv. 1991
22.19
+7.515
51.21%
1 janv. 1992
16.266
-5.923
-26.69%
1 janv. 1993
11.8
-4.467
-27.46%
1 janv. 1994
8.853
-2.946
-24.97%
1 janv. 1995
13.85
+4.997
56.44%
1 janv. 1996
15.985
+2.135
15.42%
1 janv. 1997
25.041
+9.056
56.65%
1 janv. 1998
27.192
+2.151
8.59%
1 janv. 1999
20.405
-6.787
-24.96%
1 janv. 2000
23.089
+2.683
13.15%
1 janv. 2001
29.168
+6.079
26.33%
1 janv. 2002
23.441
-5.726
-19.63%
1 janv. 2003
24.444
+1.002
4.28%
1 janv. 2004
24.078
-0.365
-1.49%
1 janv. 2005
31.115
+7.036
29.22%
1 janv. 2006
36.337
+5.223
16.79%
1 janv. 2007
35.767
-0.57
-1.57%
1 janv. 2008
30.112
-5.655
-15.81%
1 janv. 2009
30.874
+0.762
2.53%
1 janv. 2010
16.135
-14.739
-47.74%
1 janv. 2011
25.614
+9.479
58.75%
1 janv. 2012
25.371
-0.244
-0.95%
1 janv. 2013
20.237
-5.134
-20.24%
Classement des pays selon les statistiques actuelles par années


Commentaires: