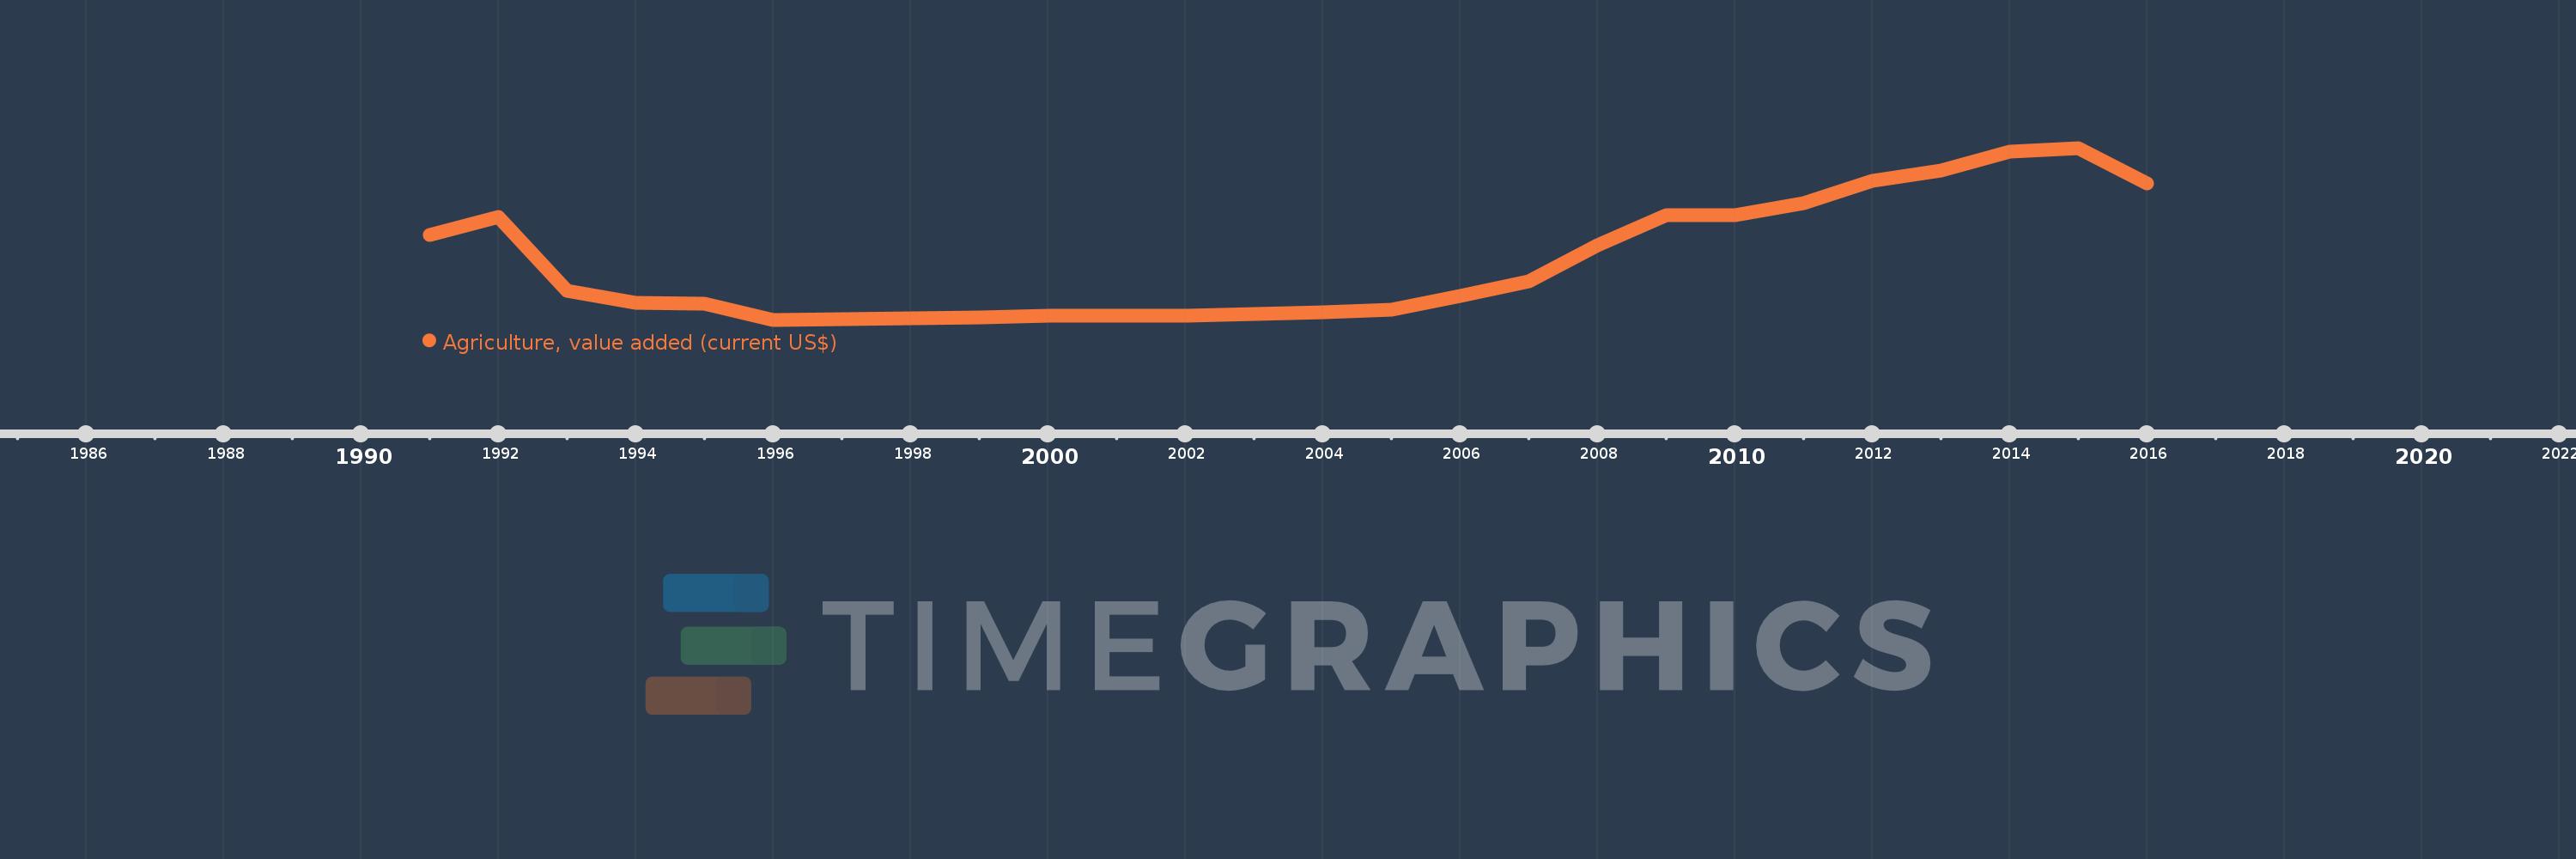
Cette échelle de temps montre un graphique de 1991 année à 2016 année Azerbaijan. Les données jusqu'à 1990 année ne sont pas présentés. Quantité d'observations actuelles selon dates: 26.
Source (désignation):
Les indicateurs du développement mondiale
Source (organisation):
World Bank national accounts data, and OECD National Accounts data files.
Catégories:
Agriculture & Rural Development, Economy & Growth
Dernière mise à jour
23 avr. 2017
Les indicateurs de changement de valeurs selon les années
En moyenne:
1.853 mds
Minimum:
768.481 mln.
1 janv. 1996
Maximum:
3.967 mds
1 janv. 2015
Pour la date d''observation
Valeur
Changement absolu
Le changement par rapport à la valeur précédente
1 janv. 1991
2.347 mds
+2.347 mds
0.0%
1 janv. 1992
2.68 mds
+332.726 mln.
14.17%
1 janv. 1993
1.301 mds
-1.379 mds
-51.47%
1 janv. 1994
1.077 mds
-224.219 mln.
-17.24%
1 janv. 1995
1.072 mds
-4.592 mln.
-0.43%
1 janv. 1996
768.481 mln.
-303.434 mln.
-28.31%
1 janv. 1997
786.538 mln.
+18.057 mln.
2.35%
1 janv. 1998
797.591 mln.
+11.053 mln.
1.41%
1 janv. 1999
806.979 mln.
+9.388 mln.
1.18%
1 janv. 2000
842.903 mln.
+35.924 mln.
4.45%
1 janv. 2001
848.116 mln.
+5.213 mln.
0.62%
1 janv. 2002
846.758 mln.
-1.358 mln.
-0.16%
1 janv. 2003
870.223 mln.
+23.465 mln.
2.77%
1 janv. 2004
904.086 mln.
+33.863 mln.
3.89%
1 janv. 2005
953.805 mln.
+49.719 mln.
5.5%
1 janv. 2006
1.212 mds
+257.824 mln.
27.03%
1 janv. 2007
1.488 mds
+276.282 mln.
22.8%
1 janv. 2008
2.162 mds
+673.725 mln.
45.28%
1 janv. 2009
2.722 mds
+559.883 mln.
25.9%
1 janv. 2010
2.711 mds
-10.024 mln.
-0.37%
1 janv. 2011
2.933 mds
+221.73 mln.
8.18%
1 janv. 2012
3.348 mds
+415.135 mln.
14.15%
1 janv. 2013
3.543 mds
+194.282 mln.
5.8%
1 janv. 2014
3.898 mds
+355.127 mln.
10.02%
1 janv. 2015
3.967 mds
+68.825 mln.
1.77%
1 janv. 2016
3.304 mds
-662.573 mln.
-16.7%
Classement des pays selon les statistiques actuelles par années
