29
/fr/
fr
AIzaSyAYiBZKx7MnpbEhh9jyipgxe19OcubqV5w
April 1, 2024
245214
South Africa
ZAF
true
2
1
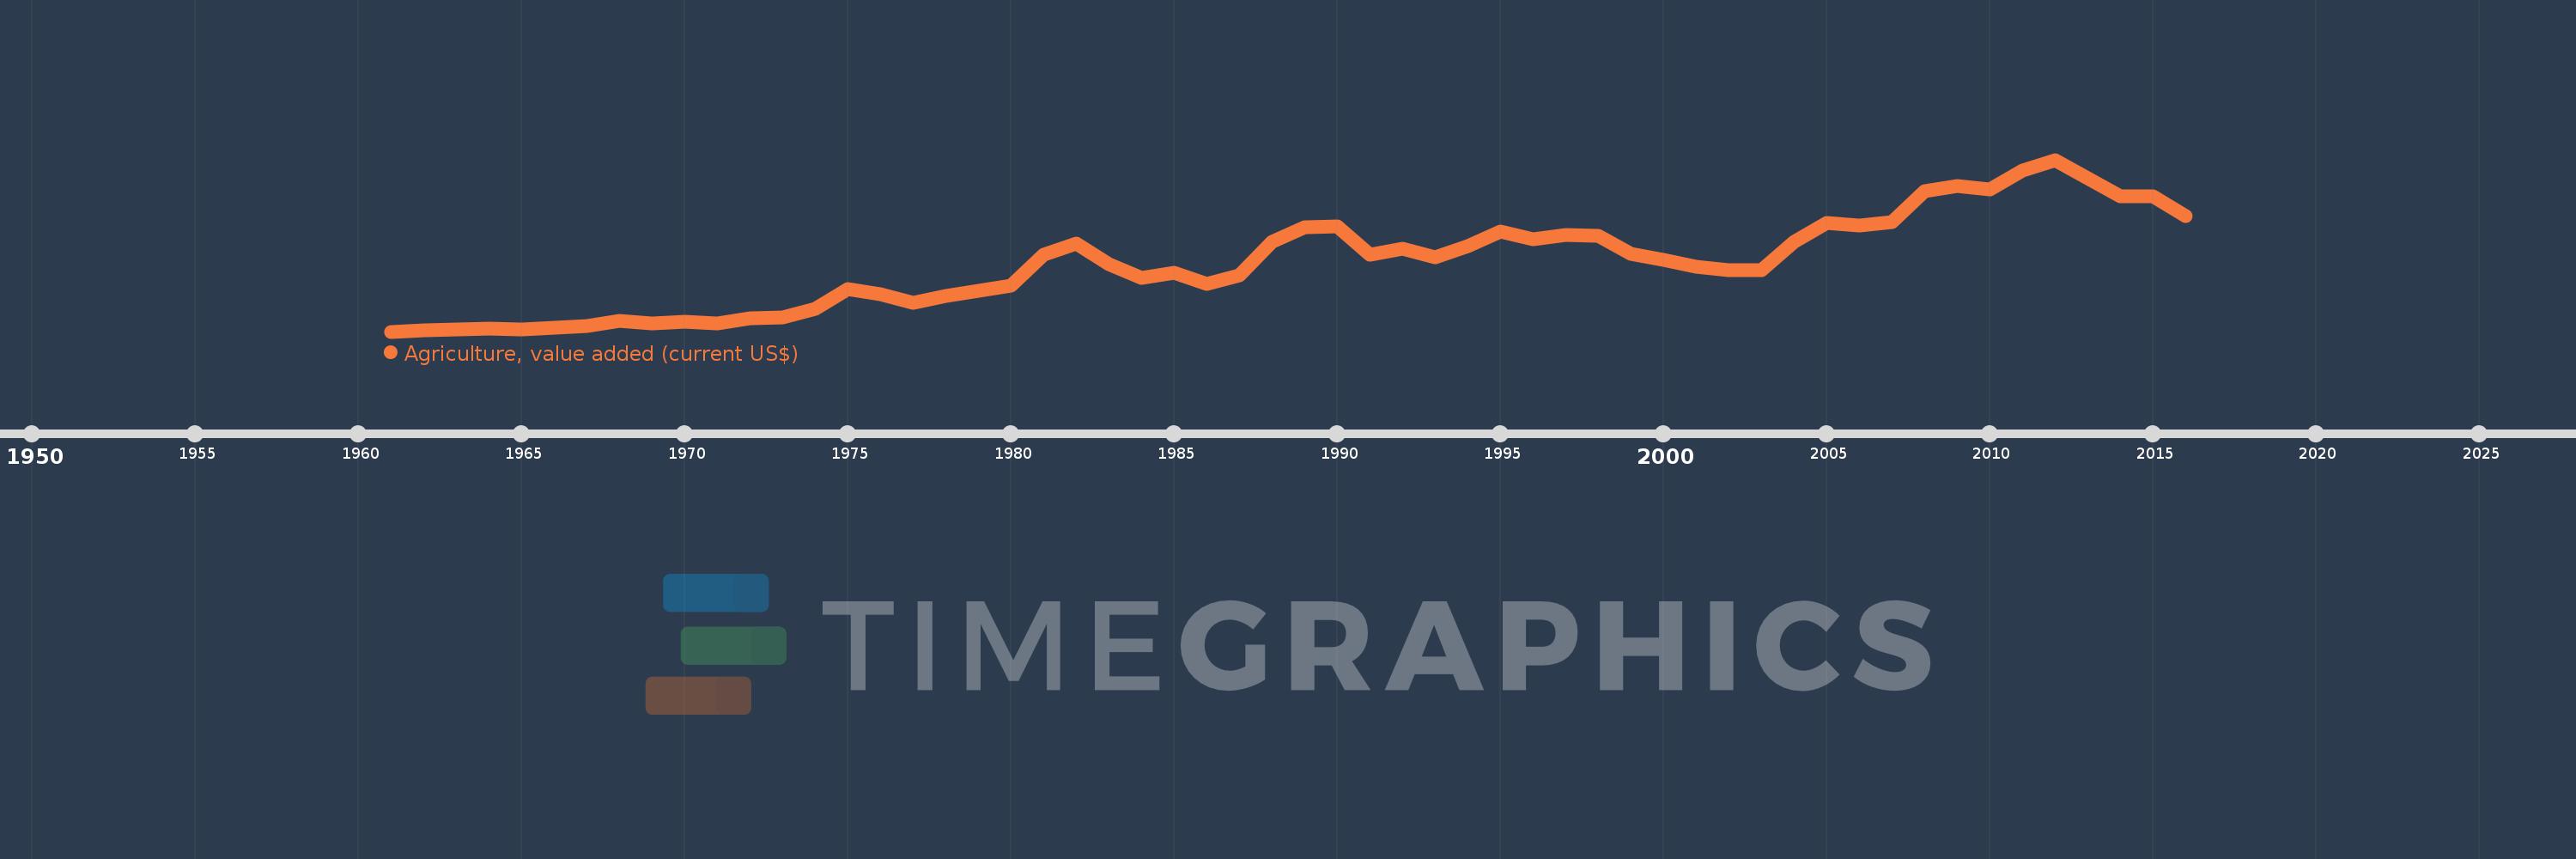
Agriculture, value added (current US$)
2016,2015,2014,2013,2012,2011,2010,2009,2008,2007,2006,2005,2004,2003,2002,2001,2000,1999,1998,1997,1996,1995,1994,1993,1992,1991,1990,1989,1988,1987,1986,1985,1984,1983,1982,1981,1980,1979,1978,1977,1976,1975,1974,1973,1972,1971,1970,1969,1968,1967,1966,1965,1964,1963,1962,1961
Cette statistique dans les autres pays:
AfghanistanAlbaniaAlgeriaAndorraAngolaAntigua and BarbudaArab WorldArgentinaArmeniaArubaAustraliaAustriaAzerbaijanBahamas, TheBahrainBangladeshBarbadosBelarusBelgiumBelizeBeninBermudaBhutanBoliviaBosnia and HerzegovinaBotswanaBrazilBrunei DarussalamBulgariaBurkina FasoBurundiCabo VerdeCambodiaCameroonCanadaCaribbean small statesCayman IslandsCentral African RepublicCentral Europe and the BalticsChadChileChinaColombiaComorosCongo, Dem. Rep.Congo, Rep.Costa RicaCote d'IvoireCroatiaCubaCyprusCzech RepublicDenmarkDjiboutiDominicaDominican RepublicEarly-demographic dividendEast Asia & PacificEast Asia & Pacific (excluding high income)East Asia & Pacific (IDA & IBRD countries)EcuadorEgypt, Arab Rep.El SalvadorEquatorial GuineaEritreaEstoniaEthiopiaEuro areaEurope & Central AsiaEurope & Central Asia (excluding high income)Europe & Central Asia (IDA & IBRD countries)European UnionFijiFinlandFragile and conflict affected situationsFranceFrench PolynesiaGabonGambia, TheGeorgiaGermanyGhanaGreeceGrenadaGuatemalaGuineaGuinea-BissauGuyanaHeavily indebted poor countries (HIPC)High incomeHondurasHong Kong SAR, ChinaHungaryIBRD onlyIcelandIDA & IBRD totalIDA blendIDA onlyIDA totalIndiaIndonesiaIran, Islamic Rep.IraqIrelandItalyJamaicaJapanJordanKazakhstanKenyaKiribatiKorea, Rep.KosovoKuwaitKyrgyz RepublicLao PDRLate-demographic dividendLatin America & Caribbean Latin America & Caribbean (excluding high income)Latin America & the Caribbean (IDA & IBRD countries)LatviaLeast developed countries: UN classificationLebanonLesothoLiberiaLibyaLithuaniaLow & middle incomeLow incomeLower middle incomeLuxembourgMacao SAR, ChinaMacedonia, FYRMadagascarMalawiMalaysiaMaldivesMaliMaltaMarshall IslandsMauritaniaMauritiusMexicoMicronesia, Fed. Sts.Middle East & North AfricaMiddle East & North Africa (excluding high income)Middle East & North Africa (IDA & IBRD countries)Middle incomeMoldovaMongoliaMontenegroMoroccoMozambiqueMyanmarNamibiaNepalNetherlandsNew CaledoniaNew ZealandNicaraguaNigerNigeriaNorth AmericaNorwayOECD membersOmanOther small statesPakistanPalauPanamaPapua New GuineaParaguayPeruPhilippinesPolandPortugalPost-demographic dividendPre-demographic dividendPuerto RicoQatarRomaniaRussian FederationRwandaSamoaSao Tome and PrincipeSaudi ArabiaSenegalSerbiaSeychellesSierra LeoneSingaporeSlovak RepublicSloveniaSmall statesSolomon IslandsSouth AfricaSouth AsiaSouth Asia (IDA & IBRD)SpainSri LankaSt. Kitts and NevisSt. LuciaSt. Vincent and the GrenadinesSub-Saharan Africa Sub-Saharan Africa (excluding high income)Sub-Saharan Africa (IDA & IBRD countries)SudanSurinameSwazilandSwedenSwitzerlandSyrian Arab RepublicTajikistanTanzaniaThailandTimor-LesteTogoTongaTrinidad and TobagoTunisiaTurkeyTurkmenistanTuvaluUgandaUkraineUnited Arab EmiratesUnited KingdomUnited StatesUpper middle incomeUruguayUzbekistanVanuatuVenezuela, RBVietnamWest Bank and GazaWorldYemen, Rep.ZambiaZimbabwe La ligne de temps
Cette échelle de temps montre un graphique de 1961 année à 2016 année South Africa. Les données jusqu'à 1960 année ne sont pas présentés. Quantité d'observations actuelles selon dates: 56.
Source (désignation):
Les indicateurs du développement mondiale
Source (organisation):
World Bank national accounts data, and OECD National Accounts data files.
Catégories:
Agriculture & Rural Development, Economy & Growth
Dernière mise à jour
23 avr. 2017
Les indicateurs de changement de valeurs selon les années
Minimum:
782.754 mln.
1 janv. 1961
Maximum:
9.517 mds
1 janv. 2012
Pour la date d''observation
Valeur
Changement absolu
Le changement par rapport à la valeur précédente
1 janv. 1961
782.754 mln.
+782.754 mln.
0.0%
1 janv. 1962
850.706 mln.
+67.952 mln.
8.68%
1 janv. 1963
870.307 mln.
+19.602 mln.
2.3%
1 janv. 1964
948.713 mln.
+78.406 mln.
9.01%
1 janv. 1965
904.283 mln.
-44.43 mln.
-4.68%
1 janv. 1966
961.781 mln.
+57.498 mln.
6.36%
1 janv. 1967
1.084 mds
+121.798 mln.
12.66%
1 janv. 1968
1.33 mds
+246.395 mln.
22.74%
1 janv. 1969
1.208 mds
-121.798 mln.
-9.16%
1 janv. 1970
1.27 mds
+61.599 mln.
5.1%
1 janv. 1971
1.205 mds
-64.399 mln.
-5.07%
1 janv. 1972
1.444 mds
+238.975 mln.
19.83%
1 janv. 1973
1.492 mds
+47.778 mln.
3.31%
1 janv. 1974
1.948 mds
+455.997 mln.
30.56%
1 janv. 1975
2.936 mds
+987.856 mln.
50.71%
1 janv. 1976
2.684 mds
-251.737 mln.
-8.57%
1 janv. 1977
2.263 mds
-421.137 mln.
-15.69%
1 janv. 1978
2.609 mds
+346.136 mln.
15.29%
1 janv. 1979
2.85 mds
+240.341 mln.
9.21%
1 janv. 1980
3.119 mds
+269.179 mln.
9.45%
1 janv. 1981
4.692 mds
+1.573 mds
50.44%
1 janv. 1982
5.249 mds
+557.36 mln.
11.88%
1 janv. 1983
4.214 mds
-1.035 mds
-19.72%
1 janv. 1984
3.531 mds
-682.989 mln.
-16.21%
1 janv. 1985
3.775 mds
+244.556 mln.
6.93%
1 janv. 1986
3.201 mds
-574.007 mln.
-15.2%
1 janv. 1987
3.635 mds
+433.842 mln.
13.55%
1 janv. 1988
5.357 mds
+1.722 mds
47.36%
1 janv. 1989
6.097 mds
+739.935 mln.
13.81%
1 janv. 1990
6.12 mds
+23.389 mln.
0.38%
1 janv. 1991
4.709 mds
-1.411 mds
-23.06%
1 janv. 1992
5.007 mds
+297.543 mln.
6.32%
1 janv. 1993
4.578 mds
-428.86 mln.
-8.57%
1 janv. 1994
5.145 mds
+566.825 mln.
12.38%
1 janv. 1995
5.891 mds
+745.936 mln.
14.5%
1 janv. 1996
5.499 mds
-391.804 mln.
-6.65%
1 janv. 1997
5.698 mds
+198.884 mln.
3.62%
1 janv. 1998
5.634 mds
-63.385 mln.
-1.11%
1 janv. 1999
4.751 mds
-883.609 mln.
-15.68%
1 janv. 2000
4.424 mds
-326.606 mln.
-6.87%
1 janv. 2001
4.084 mds
-340.412 mln.
-7.69%
1 janv. 2002
3.908 mds
-175.277 mln.
-4.29%
1 janv. 2003
3.908 mds
-57.371 milles
0.0%
1 janv. 2004
5.349 mds
+1.441 mds
36.87%
1 janv. 2005
6.317 mds
+967.717 mln.
18.09%
1 janv. 2006
6.16 mds
-157.352 mln.
-2.49%
1 janv. 2007
6.333 mds
+173.186 mln.
2.81%
1 janv. 2008
7.915 mds
+1.582 mds
24.98%
1 janv. 2009
8.2 mds
+285.447 mln.
3.61%
1 janv. 2010
8.03 mds
-170.071 mln.
-2.07%
1 janv. 2011
8.961 mds
+930.893 mln.
11.59%
1 janv. 2012
9.517 mds
+556.19 mln.
6.21%
1 janv. 2013
8.598 mds
-918.858 mln.
-9.65%
1 janv. 2014
7.676 mds
-922.662 mln.
-10.73%
1 janv. 2015
7.649 mds
-26.384 mln.
-0.34%
1 janv. 2016
6.668 mds
-981.746 mln.
-12.83%
Classement des pays selon les statistiques actuelles par années


Commentaires: