29
/fr/
fr
AIzaSyAYiBZKx7MnpbEhh9jyipgxe19OcubqV5w
April 1, 2024
279504
Vanuatu
VUT
true
2
1
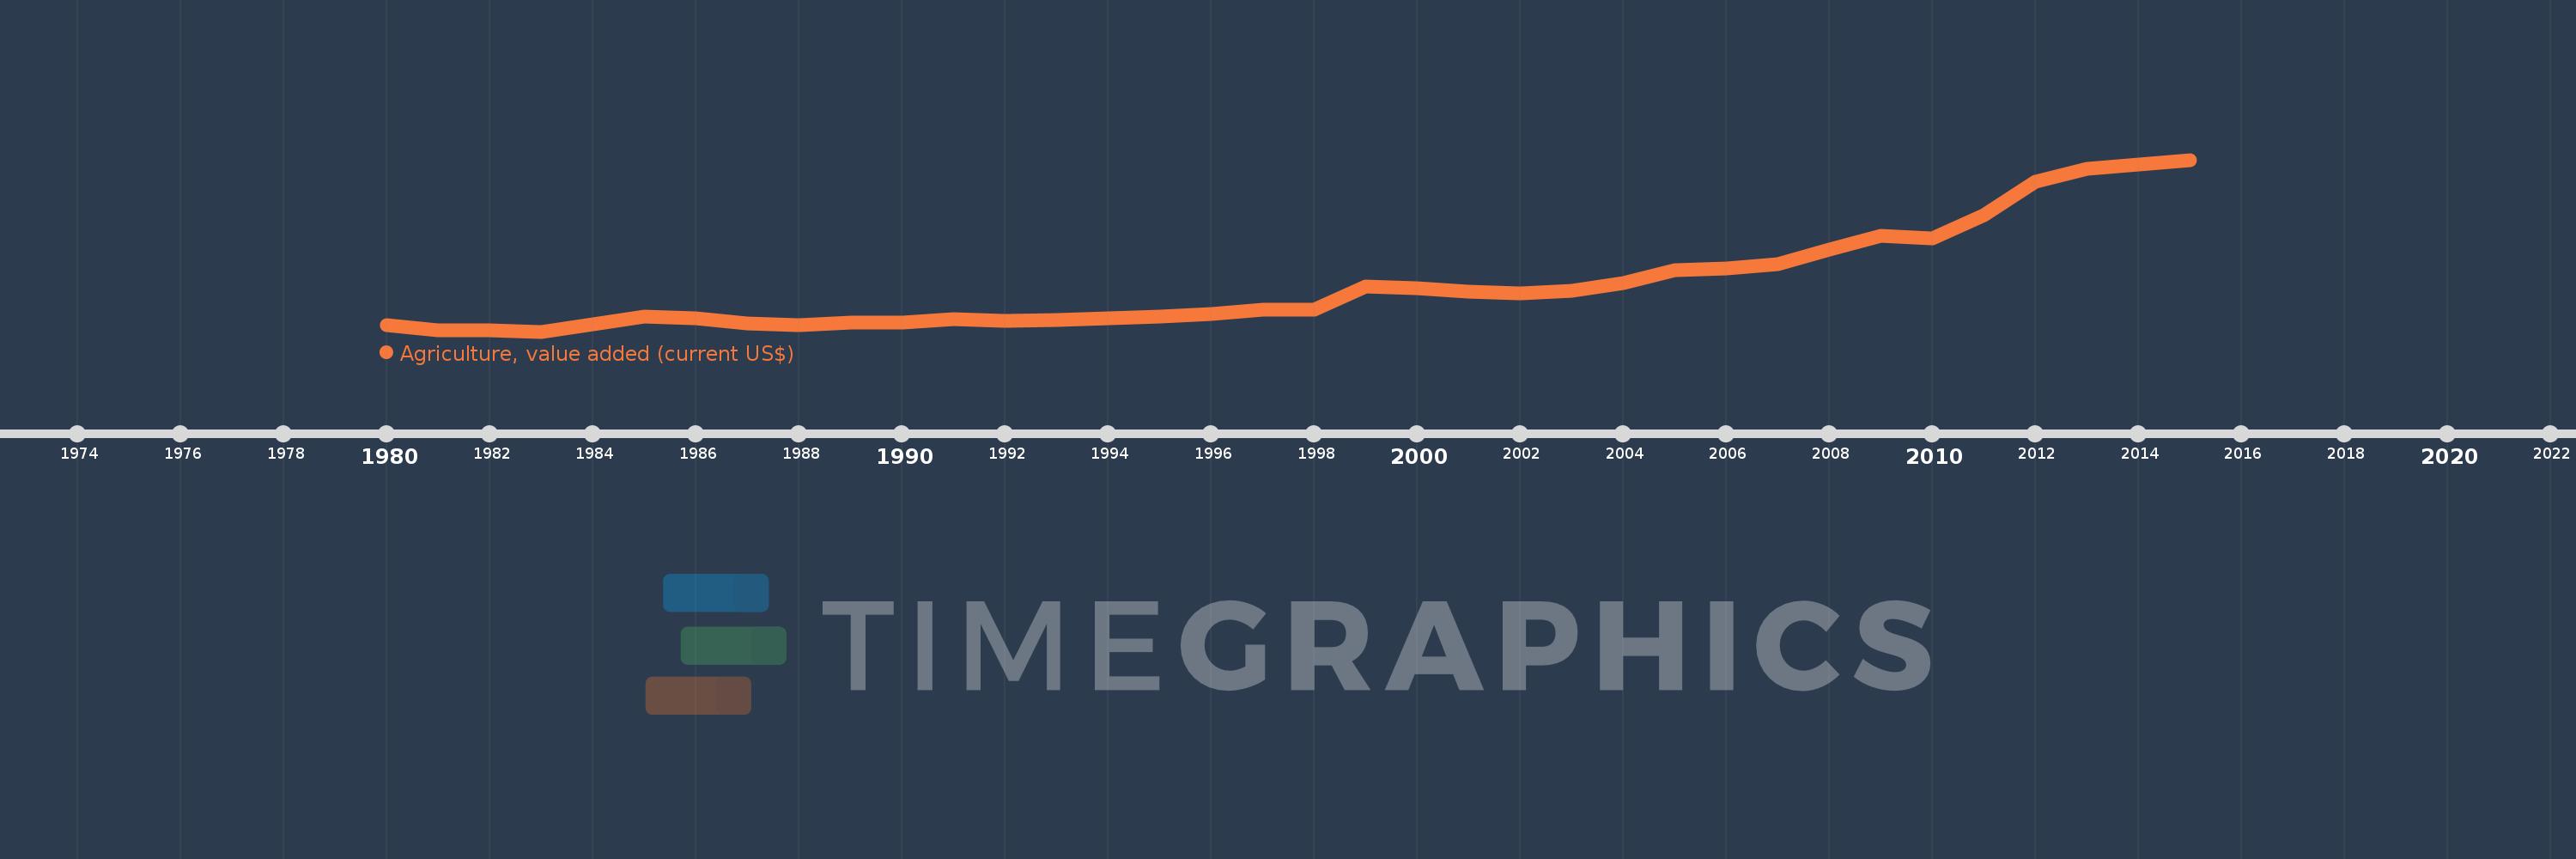
Agriculture, value added (current US$)
2015,2014,2013,2012,2011,2010,2009,2008,2007,2006,2005,2004,2003,2002,2001,2000,1999,1998,1997,1996,1995,1994,1993,1992,1991,1990,1989,1988,1987,1986,1985,1984,1983,1982,1981,1980
Cette statistique dans les autres pays:
AfghanistanAlbaniaAlgeriaAndorraAngolaAntigua and BarbudaArab WorldArgentinaArmeniaArubaAustraliaAustriaAzerbaijanBahamas, TheBahrainBangladeshBarbadosBelarusBelgiumBelizeBeninBermudaBhutanBoliviaBosnia and HerzegovinaBotswanaBrazilBrunei DarussalamBulgariaBurkina FasoBurundiCabo VerdeCambodiaCameroonCanadaCaribbean small statesCayman IslandsCentral African RepublicCentral Europe and the BalticsChadChileChinaColombiaComorosCongo, Dem. Rep.Congo, Rep.Costa RicaCote d'IvoireCroatiaCubaCyprusCzech RepublicDenmarkDjiboutiDominicaDominican RepublicEarly-demographic dividendEast Asia & PacificEast Asia & Pacific (excluding high income)East Asia & Pacific (IDA & IBRD countries)EcuadorEgypt, Arab Rep.El SalvadorEquatorial GuineaEritreaEstoniaEthiopiaEuro areaEurope & Central AsiaEurope & Central Asia (excluding high income)Europe & Central Asia (IDA & IBRD countries)European UnionFijiFinlandFragile and conflict affected situationsFranceFrench PolynesiaGabonGambia, TheGeorgiaGermanyGhanaGreeceGrenadaGuatemalaGuineaGuinea-BissauGuyanaHeavily indebted poor countries (HIPC)High incomeHondurasHong Kong SAR, ChinaHungaryIBRD onlyIcelandIDA & IBRD totalIDA blendIDA onlyIDA totalIndiaIndonesiaIran, Islamic Rep.IraqIrelandItalyJamaicaJapanJordanKazakhstanKenyaKiribatiKorea, Rep.KosovoKuwaitKyrgyz RepublicLao PDRLate-demographic dividendLatin America & Caribbean Latin America & Caribbean (excluding high income)Latin America & the Caribbean (IDA & IBRD countries)LatviaLeast developed countries: UN classificationLebanonLesothoLiberiaLibyaLithuaniaLow & middle incomeLow incomeLower middle incomeLuxembourgMacao SAR, ChinaMacedonia, FYRMadagascarMalawiMalaysiaMaldivesMaliMaltaMarshall IslandsMauritaniaMauritiusMexicoMicronesia, Fed. Sts.Middle East & North AfricaMiddle East & North Africa (excluding high income)Middle East & North Africa (IDA & IBRD countries)Middle incomeMoldovaMongoliaMontenegroMoroccoMozambiqueMyanmarNamibiaNepalNetherlandsNew CaledoniaNew ZealandNicaraguaNigerNigeriaNorth AmericaNorwayOECD membersOmanOther small statesPakistanPalauPanamaPapua New GuineaParaguayPeruPhilippinesPolandPortugalPost-demographic dividendPre-demographic dividendPuerto RicoQatarRomaniaRussian FederationRwandaSamoaSao Tome and PrincipeSaudi ArabiaSenegalSerbiaSeychellesSierra LeoneSingaporeSlovak RepublicSloveniaSmall statesSolomon IslandsSouth AfricaSouth AsiaSouth Asia (IDA & IBRD)SpainSri LankaSt. Kitts and NevisSt. LuciaSt. Vincent and the GrenadinesSub-Saharan Africa Sub-Saharan Africa (excluding high income)Sub-Saharan Africa (IDA & IBRD countries)SudanSurinameSwazilandSwedenSwitzerlandSyrian Arab RepublicTajikistanTanzaniaThailandTimor-LesteTogoTongaTrinidad and TobagoTunisiaTurkeyTurkmenistanTuvaluUgandaUkraineUnited Arab EmiratesUnited KingdomUnited StatesUpper middle incomeUruguayUzbekistanVanuatuVenezuela, RBVietnamWest Bank and GazaWorldYemen, Rep.ZambiaZimbabwe La ligne de temps
Cette échelle de temps montre un graphique de 1980 année à 2015 année Vanuatu. Les données jusqu'à 1979 année ne sont pas présentés. Quantité d'observations actuelles selon dates: 36.
Source (désignation):
Les indicateurs du développement mondiale
Source (organisation):
World Bank national accounts data, and OECD National Accounts data files.
Catégories:
Agriculture & Rural Development, Economy & Growth
Dernière mise à jour
23 avr. 2017
Les indicateurs de changement de valeurs selon les années
Minimum:
19.601 mln.
1 janv. 1983
Maximum:
205.333 mln.
1 janv. 2015
Pour la date d''observation
Valeur
Changement absolu
Le changement par rapport à la valeur précédente
1 janv. 1980
26.179 mln.
+26.179 mln.
0.0%
1 janv. 1981
21.434 mln.
-4.744 mln.
-18.12%
1 janv. 1982
21.083 mln.
-351.835 milles
-1.64%
1 janv. 1983
19.601 mln.
-1.481 mln.
-7.03%
1 janv. 1984
27.644 mln.
+8.043 mln.
41.03%
1 janv. 1985
36.259 mln.
+8.615 mln.
31.16%
1 janv. 1986
34.414 mln.
-1.845 mln.
-5.09%
1 janv. 1987
28.419 mln.
-5.995 mln.
-17.42%
1 janv. 1988
26.646 mln.
-1.773 mln.
-6.24%
1 janv. 1989
29.744 mln.
+3.098 mln.
11.63%
1 janv. 1990
29.308 mln.
-435.197 milles
-1.46%
1 janv. 1991
33.069 mln.
+3.76 mln.
12.83%
1 janv. 1992
31.277 mln.
-1.792 mln.
-5.42%
1 janv. 1993
31.775 mln.
+497.866 milles
1.59%
1 janv. 1994
33.994 mln.
+2.219 mln.
6.98%
1 janv. 1995
35.703 mln.
+1.709 mln.
5.03%
1 janv. 1996
38.462 mln.
+2.759 mln.
7.73%
1 janv. 1997
43.153 mln.
+4.691 mln.
12.2%
1 janv. 1998
42.85 mln.
-303.165 milles
-0.7%
1 janv. 1999
68.453 mln.
+25.604 mln.
59.75%
1 janv. 2000
66.589 mln.
-1.864 mln.
-2.72%
1 janv. 2001
62.466 mln.
-4.123 mln.
-6.19%
1 janv. 2002
60.69 mln.
-1.776 mln.
-2.84%
1 janv. 2003
63.722 mln.
+3.032 mln.
5.0%
1 janv. 2004
71.79 mln.
+8.068 mln.
12.66%
1 janv. 2005
86.135 mln.
+14.344 mln.
19.98%
1 janv. 2006
87.976 mln.
+1.841 mln.
2.14%
1 janv. 2007
92.199 mln.
+4.223 mln.
4.8%
1 janv. 2008
108.232 mln.
+16.033 mln.
17.39%
1 janv. 2009
122.762 mln.
+14.53 mln.
13.43%
1 janv. 2010
120.554 mln.
-2.208 mln.
-1.8%
1 janv. 2011
145.244 mln.
+24.69 mln.
20.48%
1 janv. 2012
181.247 mln.
+36.003 mln.
24.79%
1 janv. 2013
195.547 mln.
+14.3 mln.
7.89%
1 janv. 2014
200.386 mln.
+4.839 mln.
2.47%
1 janv. 2015
205.333 mln.
+4.947 mln.
2.47%
Classement des pays selon les statistiques actuelles par années


Commentaires: