29
/fr/
fr
AIzaSyAYiBZKx7MnpbEhh9jyipgxe19OcubqV5w
April 1, 2024
234393
Saudi Arabia
SAU
true
2
1
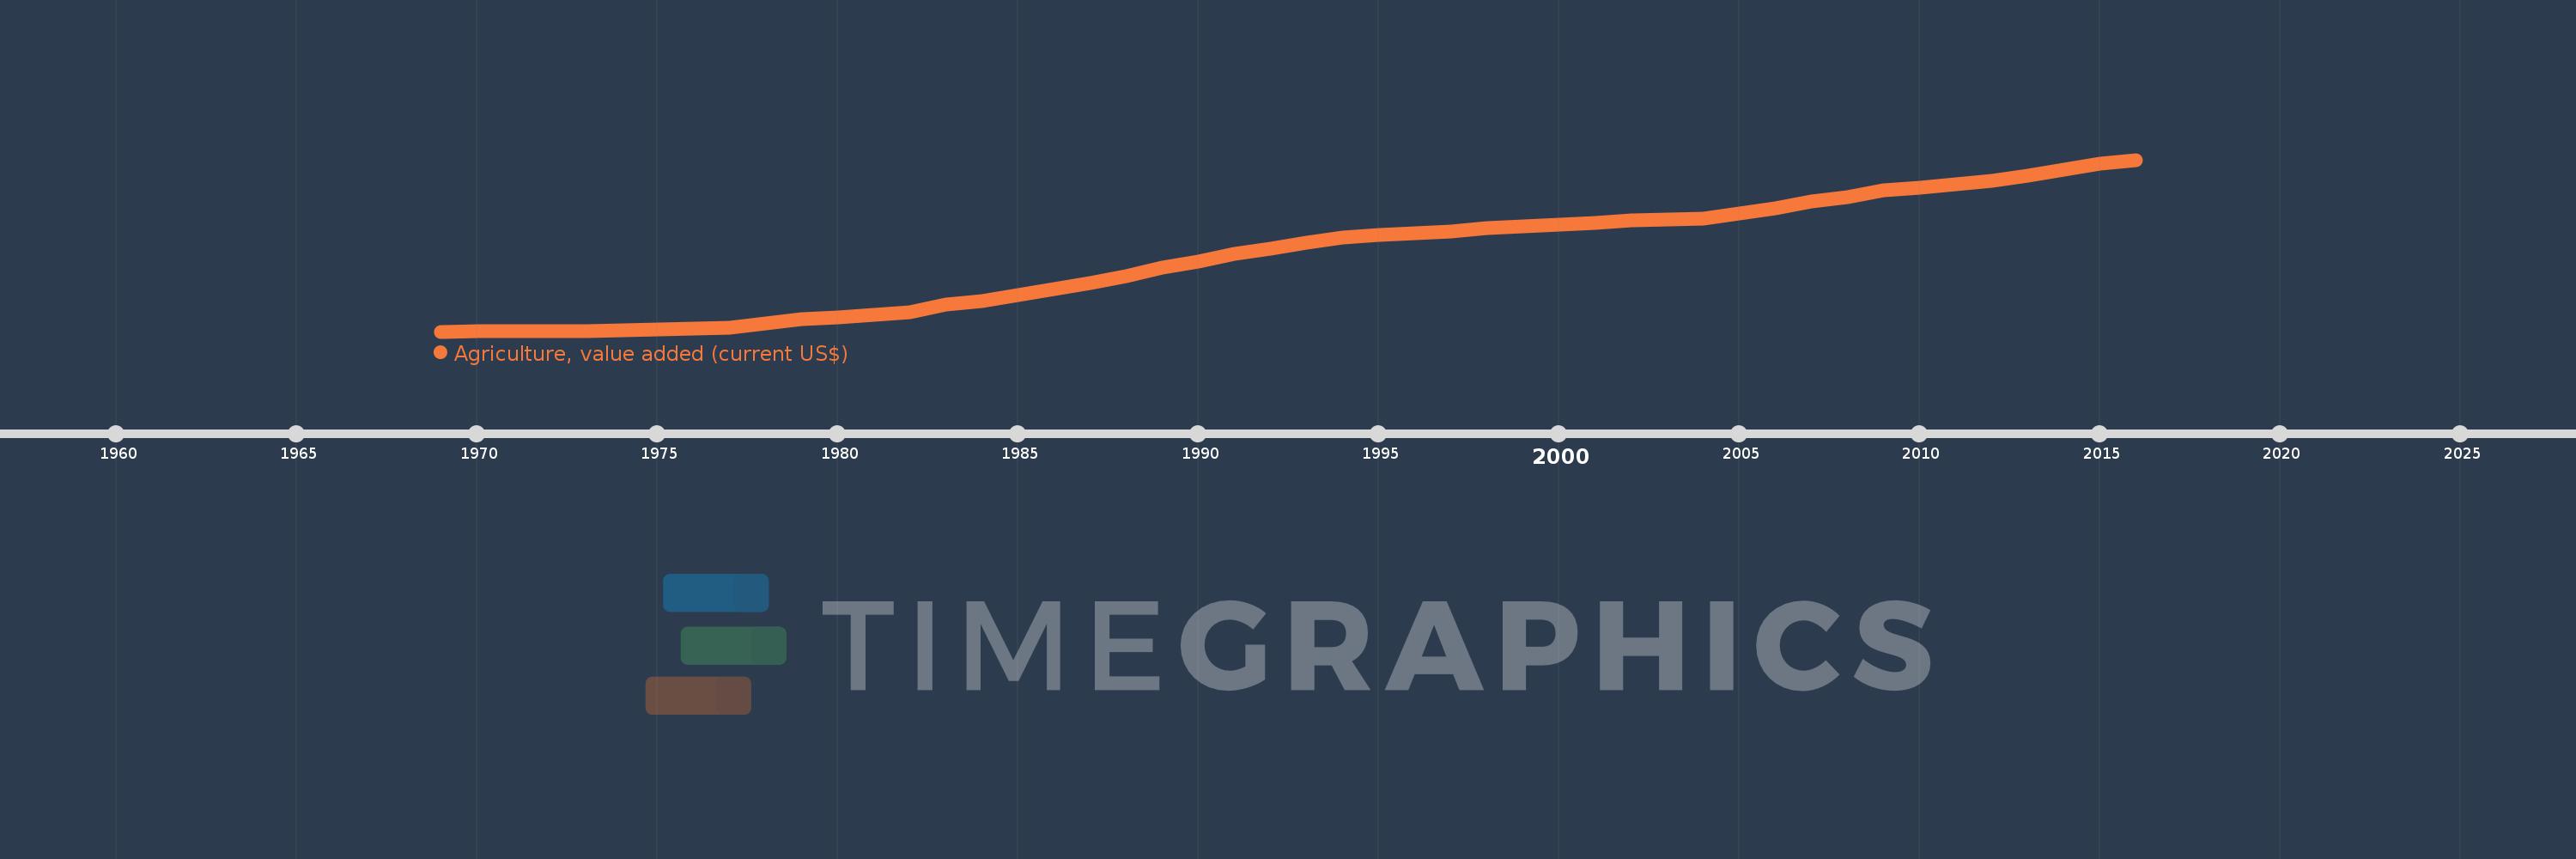
Agriculture, value added (current US$)
2016,2015,2014,2013,2012,2011,2010,2009,2008,2007,2006,2005,2004,2003,2002,2001,2000,1999,1998,1997,1996,1995,1994,1993,1992,1991,1990,1989,1988,1987,1986,1985,1984,1983,1982,1981,1980,1979,1978,1977,1976,1975,1974,1973,1972,1971,1970,1969
Cette statistique dans les autres pays:
AfghanistanAlbaniaAlgeriaAndorraAngolaAntigua and BarbudaArab WorldArgentinaArmeniaArubaAustraliaAustriaAzerbaijanBahamas, TheBahrainBangladeshBarbadosBelarusBelgiumBelizeBeninBermudaBhutanBoliviaBosnia and HerzegovinaBotswanaBrazilBrunei DarussalamBulgariaBurkina FasoBurundiCabo VerdeCambodiaCameroonCanadaCaribbean small statesCayman IslandsCentral African RepublicCentral Europe and the BalticsChadChileChinaColombiaComorosCongo, Dem. Rep.Congo, Rep.Costa RicaCote d'IvoireCroatiaCubaCyprusCzech RepublicDenmarkDjiboutiDominicaDominican RepublicEarly-demographic dividendEast Asia & PacificEast Asia & Pacific (excluding high income)East Asia & Pacific (IDA & IBRD countries)EcuadorEgypt, Arab Rep.El SalvadorEquatorial GuineaEritreaEstoniaEthiopiaEuro areaEurope & Central AsiaEurope & Central Asia (excluding high income)Europe & Central Asia (IDA & IBRD countries)European UnionFijiFinlandFragile and conflict affected situationsFranceFrench PolynesiaGabonGambia, TheGeorgiaGermanyGhanaGreeceGrenadaGuatemalaGuineaGuinea-BissauGuyanaHeavily indebted poor countries (HIPC)High incomeHondurasHong Kong SAR, ChinaHungaryIBRD onlyIcelandIDA & IBRD totalIDA blendIDA onlyIDA totalIndiaIndonesiaIran, Islamic Rep.IraqIrelandItalyJamaicaJapanJordanKazakhstanKenyaKiribatiKorea, Rep.KosovoKuwaitKyrgyz RepublicLao PDRLate-demographic dividendLatin America & Caribbean Latin America & Caribbean (excluding high income)Latin America & the Caribbean (IDA & IBRD countries)LatviaLeast developed countries: UN classificationLebanonLesothoLiberiaLibyaLithuaniaLow & middle incomeLow incomeLower middle incomeLuxembourgMacao SAR, ChinaMacedonia, FYRMadagascarMalawiMalaysiaMaldivesMaliMaltaMarshall IslandsMauritaniaMauritiusMexicoMicronesia, Fed. Sts.Middle East & North AfricaMiddle East & North Africa (excluding high income)Middle East & North Africa (IDA & IBRD countries)Middle incomeMoldovaMongoliaMontenegroMoroccoMozambiqueMyanmarNamibiaNepalNetherlandsNew CaledoniaNew ZealandNicaraguaNigerNigeriaNorth AmericaNorwayOECD membersOmanOther small statesPakistanPalauPanamaPapua New GuineaParaguayPeruPhilippinesPolandPortugalPost-demographic dividendPre-demographic dividendPuerto RicoQatarRomaniaRussian FederationRwandaSamoaSao Tome and PrincipeSaudi ArabiaSenegalSerbiaSeychellesSierra LeoneSingaporeSlovak RepublicSloveniaSmall statesSolomon IslandsSouth AfricaSouth AsiaSouth Asia (IDA & IBRD)SpainSri LankaSt. Kitts and NevisSt. LuciaSt. Vincent and the GrenadinesSub-Saharan Africa Sub-Saharan Africa (excluding high income)Sub-Saharan Africa (IDA & IBRD countries)SudanSurinameSwazilandSwedenSwitzerlandSyrian Arab RepublicTajikistanTanzaniaThailandTimor-LesteTogoTongaTrinidad and TobagoTunisiaTurkeyTurkmenistanTuvaluUgandaUkraineUnited Arab EmiratesUnited KingdomUnited StatesUpper middle incomeUruguayUzbekistanVanuatuVenezuela, RBVietnamWest Bank and GazaWorldYemen, Rep.ZambiaZimbabwe La ligne de temps
Cette échelle de temps montre un graphique de 1969 année à 2016 année Saudi Arabia. Les données jusqu'à 1968 année ne sont pas présentés. Quantité d'observations actuelles selon dates: 48.
Source (désignation):
Les indicateurs du développement mondiale
Source (organisation):
World Bank national accounts data, and OECD National Accounts data files.
Catégories:
Agriculture & Rural Development, Economy & Growth
Dernière mise à jour
23 avr. 2017
Les indicateurs de changement de valeurs selon les années
Minimum:
206.667 mln.
1 janv. 1969
Maximum:
14.626 mds
1 janv. 2016
Pour la date d''observation
Valeur
Changement absolu
Le changement par rapport à la valeur précédente
1 janv. 1969
206.667 mln.
+206.667 mln.
0.0%
1 janv. 1970
220.667 mln.
+14.0 mln.
6.77%
1 janv. 1971
227.778 mln.
+7.111 mln.
3.22%
1 janv. 1972
237.14 mln.
+9.362 mln.
4.11%
1 janv. 1973
272.148 mln.
+35.008 mln.
14.76%
1 janv. 1974
328.603 mln.
+56.455 mln.
20.74%
1 janv. 1975
379.437 mln.
+50.834 mln.
15.47%
1 janv. 1976
434.387 mln.
+54.95 mln.
14.48%
1 janv. 1977
506.516 mln.
+72.128 mln.
16.6%
1 janv. 1978
869.763 mln.
+363.247 mln.
71.71%
1 janv. 1979
1.234 mds
+364.206 mln.
41.87%
1 janv. 1980
1.369 mds
+135.051 mln.
10.94%
1 janv. 1981
1.623 mds
+253.91 mln.
18.55%
1 janv. 1982
1.849 mds
+226.294 mln.
13.94%
1 janv. 1983
2.442 mds
+592.874 mln.
32.06%
1 janv. 1984
2.791 mds
+348.93 mln.
14.29%
1 janv. 1985
3.297 mds
+506.362 mln.
18.14%
1 janv. 1986
3.807 mds
+509.623 mln.
15.46%
1 janv. 1987
4.283 mds
+476.271 mln.
12.51%
1 janv. 1988
4.89 mds
+606.436 mln.
14.16%
1 janv. 1989
5.579 mds
+689.72 mln.
14.11%
1 janv. 1990
6.048 mds
+468.625 mln.
8.4%
1 janv. 1991
6.713 mds
+665.421 mln.
11.0%
1 janv. 1992
7.183 mds
+469.96 mln.
7.0%
1 janv. 1993
7.686 mds
+502.804 mln.
7.0%
1 janv. 1994
8.07 mds
+384.246 mln.
5.0%
1 janv. 1995
8.313 mds
+242.19 mln.
3.0%
1 janv. 1996
8.437 mds
+124.7 mln.
1.5%
1 janv. 1997
8.588 mds
+150.601 mln.
1.78%
1 janv. 1998
8.919 mds
+330.574 mln.
3.85%
1 janv. 1999
9.04 mds
+121.709 mln.
1.36%
1 janv. 2000
9.185 mds
+144.533 mln.
1.6%
1 janv. 2001
9.326 mds
+141.333 mln.
1.54%
1 janv. 2002
9.522 mds
+196.0 mln.
2.1%
1 janv. 2003
9.627 mds
+104.8 mln.
1.1%
1 janv. 2004
9.721 mds
+94.133 mln.
0.98%
1 janv. 2005
10.094 mds
+372.8 mln.
3.83%
1 janv. 2006
10.579 mds
+485.248 mln.
4.81%
1 janv. 2007
11.113 mds
+534.103 mln.
5.05%
1 janv. 2008
11.523 mds
+409.664 mln.
3.69%
1 janv. 2009
12.043 mds
+520.051 mln.
4.51%
1 janv. 2010
12.247 mds
+204.0 mln.
1.69%
1 janv. 2011
12.55 mds
+303.2 mln.
2.48%
1 janv. 2012
12.843 mds
+293.333 mln.
2.34%
1 janv. 2013
13.284 mds
+440.533 mln.
3.43%
1 janv. 2014
13.796 mds
+512.267 mln.
3.86%
1 janv. 2015
14.325 mds
+528.8 mln.
3.83%
1 janv. 2016
14.626 mds
+301.067 mln.
2.1%
Classement des pays selon les statistiques actuelles par années


Commentaires: