29
/fr/
fr
AIzaSyAYiBZKx7MnpbEhh9jyipgxe19OcubqV5w
April 1, 2024
73469
Australia
AUS
true
2
1
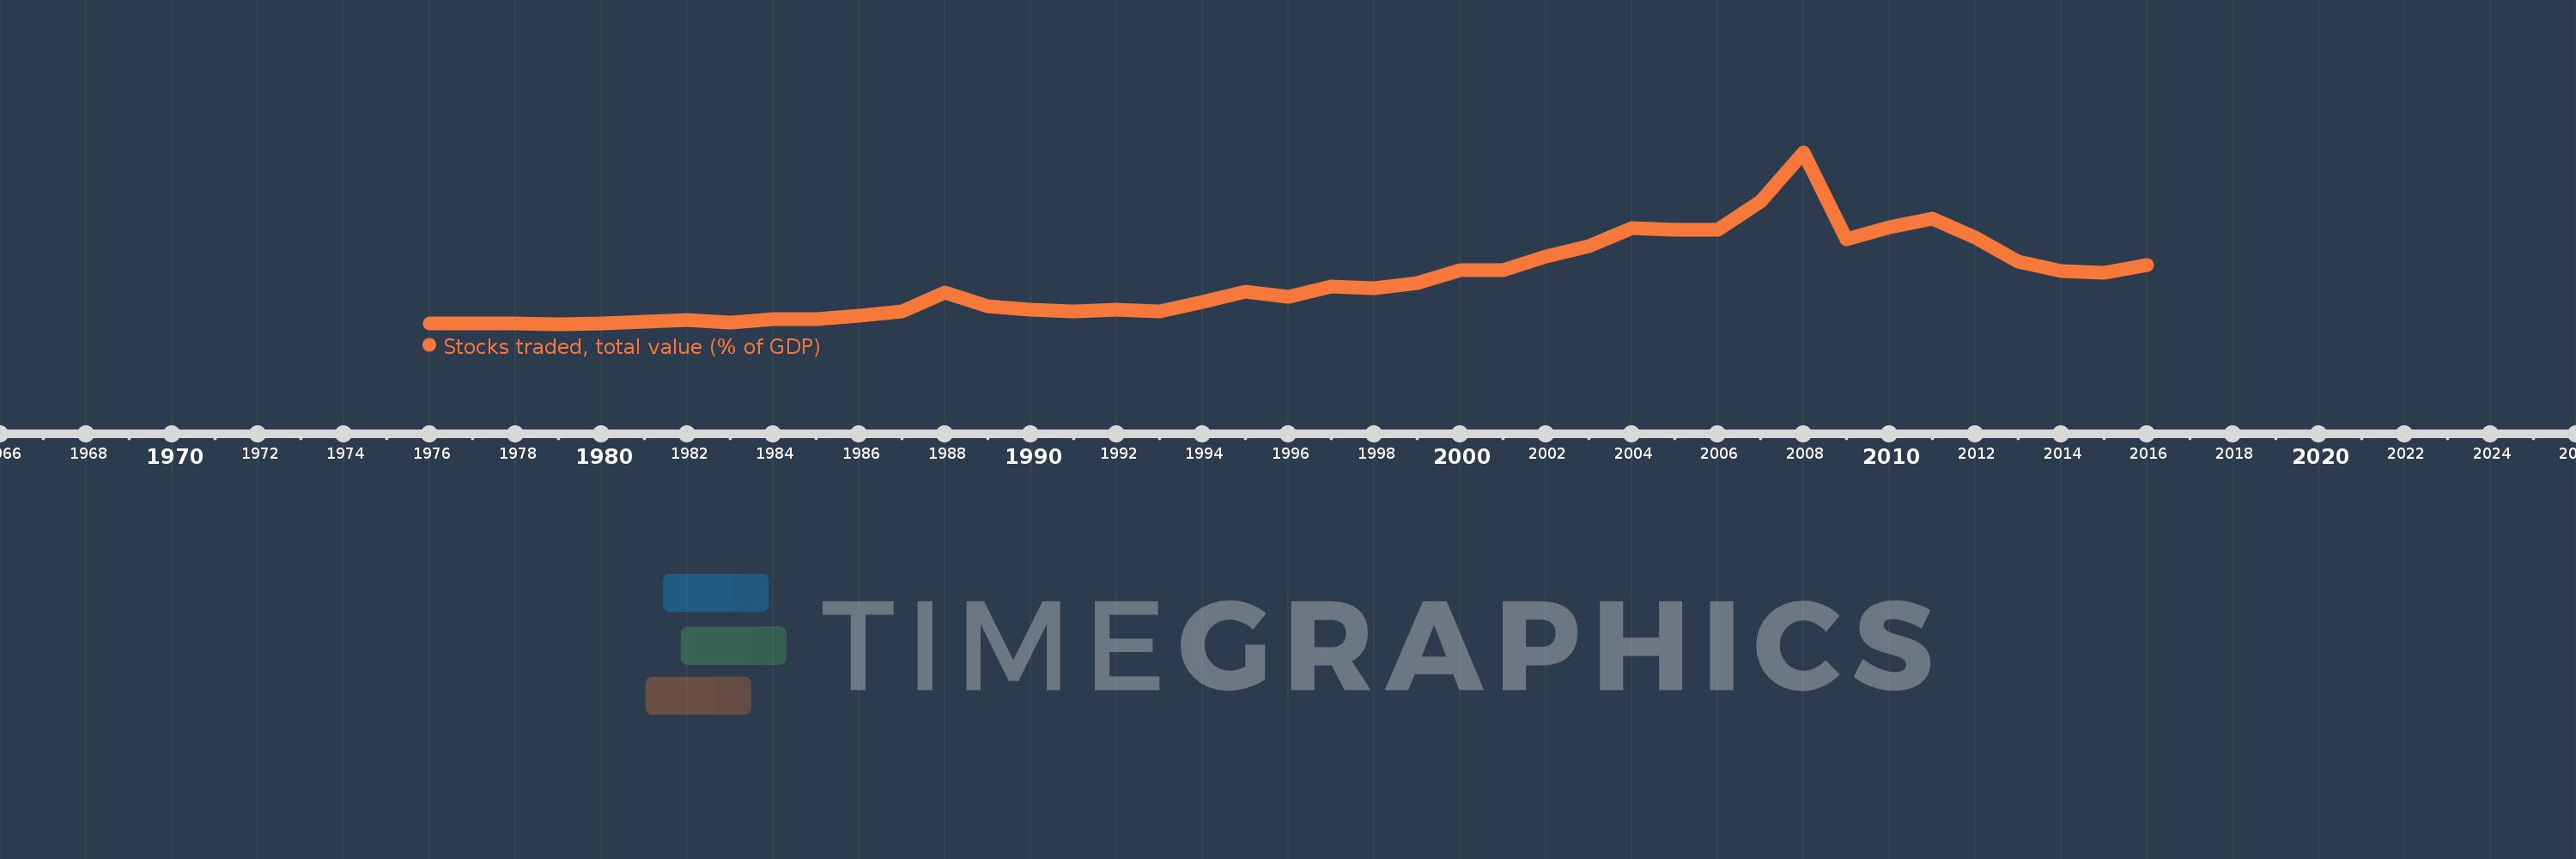
Stocks traded, total value (% of GDP)
2016,2015,2014,2013,2012,2011,2010,2009,2008,2007,2006,2005,2004,2003,2002,2001,2000,1999,1998,1997,1996,1995,1994,1993,1992,1991,1990,1989,1988,1987,1986,1985,1984,1983,1982,1981,1980,1979,1978,1977,1976
Cette statistique dans les autres pays:
La ligne de temps
Cette échelle de temps montre un graphique de 1976 année à 2016 année Australia. Les données jusqu'à 1975 année ne sont pas présentés. Quantité d'observations actuelles selon dates: 41.
Source (désignation):
Les indicateurs du développement mondiale
Source (organisation):
World Federation of Exchanges database.
Catégories:
Financial Sector
Dernière mise à jour
23 avr. 2017
Les indicateurs de changement de valeurs selon les années
Minimum:
0.747
1 janv. 1979
Maximum:
160.982
1 janv. 2008
Pour la date d''observation
Valeur
Changement absolu
Le changement par rapport à la valeur précédente
1 janv. 1976
1.206
+1.206
0.0%
1 janv. 1977
1.278
+0.072
5.99%
1 janv. 1978
1.347
+0.069
5.36%
1 janv. 1979
0.747
-0.6
-44.55%
1 janv. 1980
1.49
+0.743
99.48%
1 janv. 1981
3.307
+1.817
121.92%
1 janv. 1982
4.412
+1.105
33.43%
1 janv. 1983
2.541
-1.87
-42.4%
1 janv. 1984
5.277
+2.735
107.63%
1 janv. 1985
5.232
-0.045
-0.85%
1 janv. 1986
8.471
+3.239
61.9%
1 janv. 1987
12.452
+3.981
47.0%
1 janv. 1988
30.41
+17.958
144.22%
1 janv. 1989
17.375
-13.036
-42.87%
1 janv. 1990
14.541
-2.833
-16.31%
1 janv. 1991
12.923
-1.618
-11.13%
1 janv. 1992
14.028
+1.104
8.55%
1 janv. 1993
12.93
-1.098
-7.83%
1 janv. 1994
21.388
+8.458
65.41%
1 janv. 1995
30.851
+9.463
44.24%
1 janv. 1996
26.688
-4.163
-13.49%
1 janv. 1997
36.12
+9.433
35.34%
1 janv. 1998
34.486
-1.634
-4.52%
1 janv. 1999
38.952
+4.466
12.95%
1 janv. 2000
51.151
+12.199
31.32%
1 janv. 2001
51.385
+0.234
0.46%
1 janv. 2002
63.566
+12.181
23.7%
1 janv. 2003
73.807
+10.242
16.11%
1 janv. 2004
90.419
+16.612
22.51%
1 janv. 2005
88.939
-1.481
-1.64%
1 janv. 2006
88.399
-0.54
-0.61%
1 janv. 2007
115.004
+26.605
30.1%
1 janv. 2008
160.982
+45.978
39.98%
1 janv. 2009
79.629
-81.353
-50.54%
1 janv. 2010
90.817
+11.188
14.05%
1 janv. 2011
99.045
+8.227
9.06%
1 janv. 2012
81.191
-17.854
-18.03%
1 janv. 2013
58.906
-22.285
-27.45%
1 janv. 2014
50.378
-8.528
-14.48%
1 janv. 2015
48.36
-2.017
-4.0%
1 janv. 2016
56.054
+7.693
15.91%
Classement des pays selon les statistiques actuelles par années


Commentaires: