30
/fr/
AIzaSyAYiBZKx7MnpbEhh9jyipgxe19OcubqV5w
April 1, 2024
165572
Jordan
JOR
true
2
1
Stocks traded, total value (% of GDP)
2016,2015,2014,2013,2012,2011,2010,2009,2008,2007,2006,2005,2004,2003,2002,2001,2000,1999,1998,1997,1996,1995,1994
Download
Bibliothèque de statistiques globales →Jordan →

Stocks traded, total value (% of GDP)

Cette statistique dans les autres pays:

Arab WorldArgentinaArmeniaAustraliaAustriaBahrainBangladeshBarbadosBelgiumBermudaBoliviaBotswanaBrazilBulgariaCanadaCayman IslandsCentral Europe and the BalticsChannel IslandsChileChinaColombiaCosta RicaCote d'IvoireCroatiaCyprusCzech RepublicDenmarkEarly-demographic dividendEast Asia & PacificEast Asia & Pacific (excluding high income)East Asia & Pacific (IDA & IBRD countries)EcuadorEgypt, Arab Rep.El SalvadorEstoniaEuro areaEurope & Central AsiaEurope & Central Asia (excluding high income)Europe & Central Asia (IDA & IBRD countries)European UnionFijiFinlandFranceGeorgiaGermanyGhanaGreeceGuyanaHigh incomeHong Kong SAR, ChinaHungaryIBRD onlyIcelandIDA & IBRD totalIDA blendIDA totalIndiaIndonesiaIran, Islamic Rep.IrelandIsraelItalyJamaicaJapanJordanKazakhstanKenyaKorea, Rep.KuwaitKyrgyz RepublicLate-demographic dividendLatin America & Caribbean Latin America & Caribbean (excluding high income)Latin America & the Caribbean (IDA & IBRD countries)LatviaLebanonLithuaniaLow & middle incomeLower middle incomeLuxembourgMacedonia, FYRMalawiMalaysiaMaltaMauritiusMexicoMiddle East & North AfricaMiddle East & North Africa (excluding high income)Middle East & North Africa (IDA & IBRD countries)Middle incomeMoldovaMongoliaMontenegroMoroccoNamibiaNetherlandsNew ZealandNigeriaNorth AmericaNorwayOECD membersOmanOther small statesPakistanPanamaPapua New GuineaParaguayPeruPhilippinesPolandPortugalPost-demographic dividendQatarRomaniaRussian FederationSaudi ArabiaSerbiaSeychellesSingaporeSlovak RepublicSloveniaSouth AfricaSouth AsiaSouth Asia (IDA & IBRD)SpainSri LankaSt. Kitts and NevisSub-Saharan Africa Sub-Saharan Africa (excluding high income)Sub-Saharan Africa (IDA & IBRD countries)SwazilandSwedenSwitzerlandTanzaniaThailandTrinidad and TobagoTunisiaTurkeyUgandaUkraineUnited Arab EmiratesUnited KingdomUnited StatesUpper middle incomeUruguayUzbekistanVenezuela, RBVietnamWest Bank and GazaWorldZambiaZimbabwe

La ligne de temps

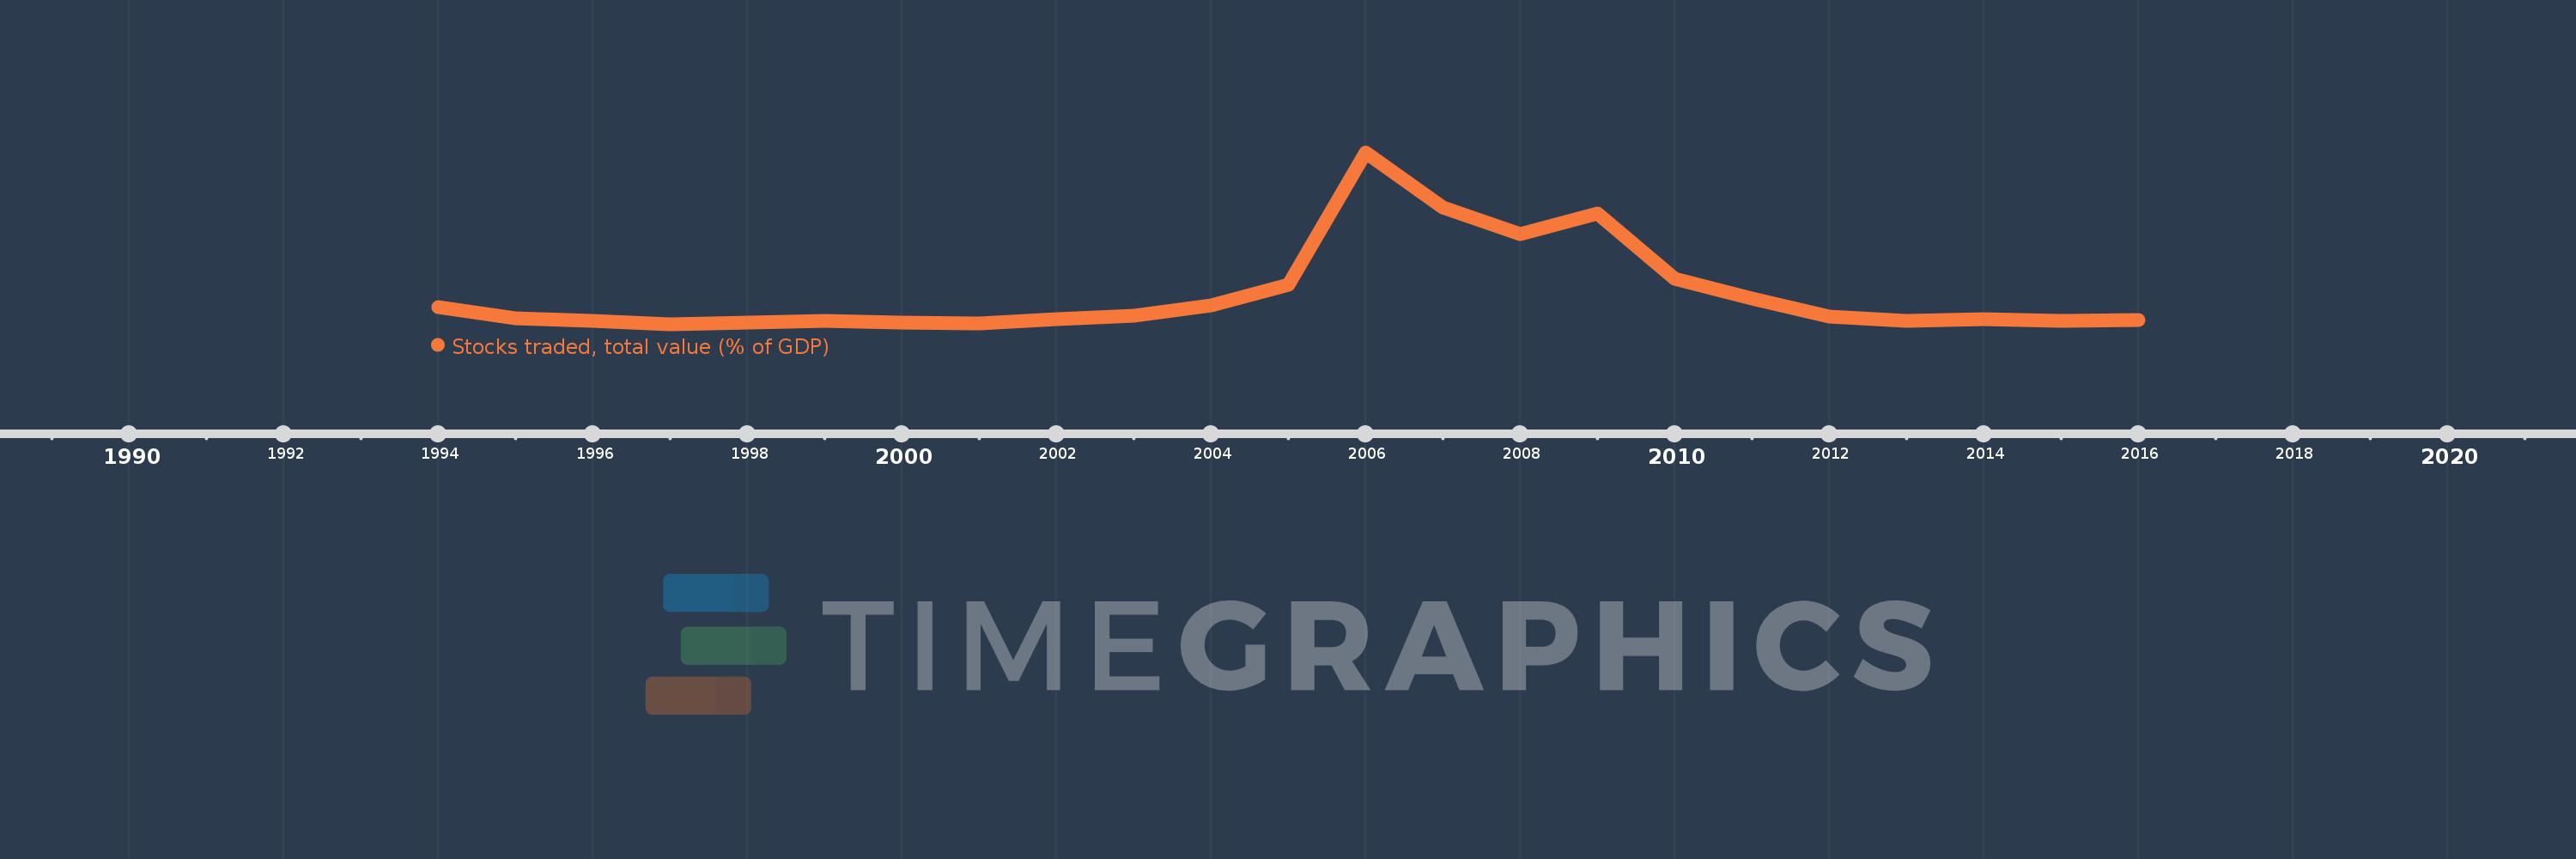
Cette échelle de temps montre un graphique de 1994 année à 2016 année Jordan. Les données jusqu'à 1993 année ne sont pas présentés. Quantité d'observations actuelles selon dates: 23.

Source (désignation):

Les indicateurs du développement mondiale

Source (organisation):

World Federation of Exchanges database.

Catégories:

Financial Sector

Dernière mise à jour

23 avr. 2017

Les indicateurs de changement de valeurs selon les années

En moyenne:
37.189
Minimum:
5.055
1 janv. 1997
Maximum:
189.183
1 janv. 2006
Pour la date d''observation
Valeur
Changement absolu
Le changement par rapport à la valeur précédente
1 janv. 1994
23.652
+23.652
0.0%
1 janv. 1995
11.273
-12.379
-52.34%
1 janv. 1996
8.785
-2.488
-22.07%
1 janv. 1997
5.055
-3.73
-42.46%
1 janv. 1998
6.914
+1.86
36.79%
1 janv. 1999
8.245
+1.33
19.24%
1 janv. 2000
6.732
-1.512
-18.35%
1 janv. 2001
5.573
-1.159
-17.21%
1 janv. 2002
10.514
+4.94
88.64%
1 janv. 2003
13.979
+3.465
32.96%
1 janv. 2004
25.67
+11.691
83.64%
1 janv. 2005
46.9
+21.231
82.71%
1 janv. 2006
189.183
+142.282
303.37%
1 janv. 2007
129.888
-59.295
-31.34%
1 janv. 2008
101.85
-28.039
-21.59%
1 janv. 2009
123.762
+21.912
21.51%
1 janv. 2010
54.182
-69.58
-56.22%
1 janv. 2011
32.534
-21.648
-39.95%
1 janv. 2012
13.514
-19.021
-58.46%
1 janv. 2013
8.824
-4.69
-34.71%
1 janv. 2014
10.202
+1.379
15.63%
1 janv. 2015
8.631
-1.571
-15.4%
1 janv. 2016
9.476
+0.844
9.78%

Classement des pays selon les statistiques actuelles par années