30
/fr/
AIzaSyAYiBZKx7MnpbEhh9jyipgxe19OcubqV5w
April 1, 2024
104469
Channel Islands
CHI
true
2
1
Stocks traded, total value (% of GDP)
2008,2007,2006,2005,2004,2003,2002,2001,2000
Download
Bibliothèque de statistiques globales →Channel Islands →

Stocks traded, total value (% of GDP)

Cette statistique dans les autres pays:

Arab WorldArgentinaArmeniaAustraliaAustriaBahrainBangladeshBarbadosBelgiumBermudaBoliviaBotswanaBrazilBulgariaCanadaCayman IslandsCentral Europe and the BalticsChannel IslandsChileChinaColombiaCosta RicaCote d'IvoireCroatiaCyprusCzech RepublicDenmarkEarly-demographic dividendEast Asia & PacificEast Asia & Pacific (excluding high income)East Asia & Pacific (IDA & IBRD countries)EcuadorEgypt, Arab Rep.El SalvadorEstoniaEuro areaEurope & Central AsiaEurope & Central Asia (excluding high income)Europe & Central Asia (IDA & IBRD countries)European UnionFijiFinlandFranceGeorgiaGermanyGhanaGreeceGuyanaHigh incomeHong Kong SAR, ChinaHungaryIBRD onlyIcelandIDA & IBRD totalIDA blendIDA totalIndiaIndonesiaIran, Islamic Rep.IrelandIsraelItalyJamaicaJapanJordanKazakhstanKenyaKorea, Rep.KuwaitKyrgyz RepublicLate-demographic dividendLatin America & Caribbean Latin America & Caribbean (excluding high income)Latin America & the Caribbean (IDA & IBRD countries)LatviaLebanonLithuaniaLow & middle incomeLower middle incomeLuxembourgMacedonia, FYRMalawiMalaysiaMaltaMauritiusMexicoMiddle East & North AfricaMiddle East & North Africa (excluding high income)Middle East & North Africa (IDA & IBRD countries)Middle incomeMoldovaMongoliaMontenegroMoroccoNamibiaNetherlandsNew ZealandNigeriaNorth AmericaNorwayOECD membersOmanOther small statesPakistanPanamaPapua New GuineaParaguayPeruPhilippinesPolandPortugalPost-demographic dividendQatarRomaniaRussian FederationSaudi ArabiaSerbiaSeychellesSingaporeSlovak RepublicSloveniaSouth AfricaSouth AsiaSouth Asia (IDA & IBRD)SpainSri LankaSt. Kitts and NevisSub-Saharan Africa Sub-Saharan Africa (excluding high income)Sub-Saharan Africa (IDA & IBRD countries)SwazilandSwedenSwitzerlandTanzaniaThailandTrinidad and TobagoTunisiaTurkeyUgandaUkraineUnited Arab EmiratesUnited KingdomUnited StatesUpper middle incomeUruguayUzbekistanVenezuela, RBVietnamWest Bank and GazaWorldZambiaZimbabwe

La ligne de temps

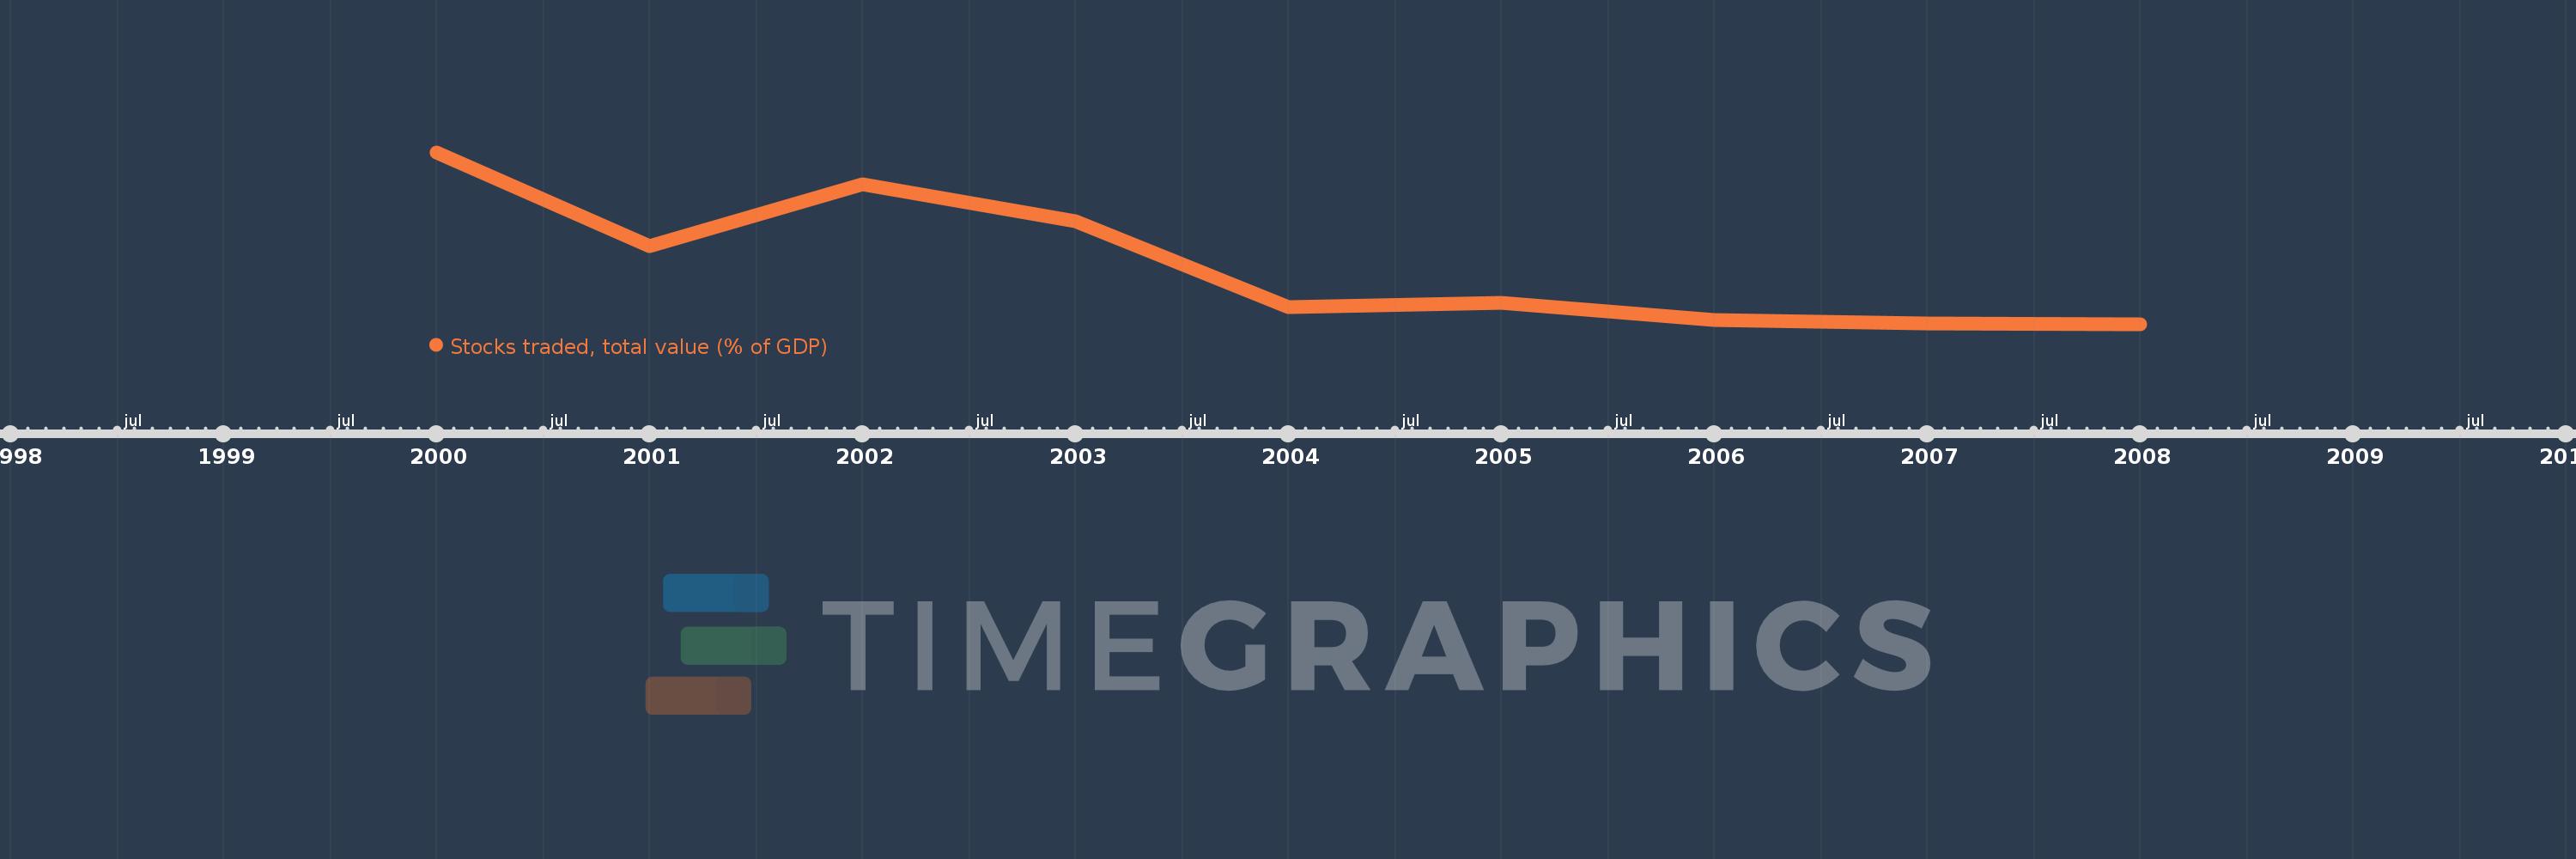
Cette échelle de temps montre un graphique de 2000 année à 2008 année Channel Islands. Les données jusqu'à 1999 année ne sont pas présentés. Quantité d'observations actuelles selon dates: 9.

Source (désignation):

Les indicateurs du développement mondiale

Source (organisation):

World Federation of Exchanges database.

Catégories:

Financial Sector

Dernière mise à jour

23 avr. 2017

Les indicateurs de changement de valeurs selon les années

En moyenne:
0.408
Minimum:
0.001
1 janv. 2008
Maximum:
1.174
1 janv. 2000
Pour la date d''observation
Valeur
Changement absolu
Le changement par rapport à la valeur précédente
1 janv. 2000
1.174
+1.174
0.0%
1 janv. 2001
0.535
-0.638
-54.4%
1 janv. 2002
0.959
+0.424
79.29%
1 janv. 2003
0.705
-0.254
-26.5%
1 janv. 2004
0.116
-0.59
-83.62%
1 janv. 2005
0.146
+0.031
26.71%
1 janv. 2006
0.031
-0.115
-78.72%
1 janv. 2007
0.008
-0.023
-74.12%
1 janv. 2008
0.001
-0.007
-89.23%

Classement des pays selon les statistiques actuelles par années