29
/fr/
fr
AIzaSyAYiBZKx7MnpbEhh9jyipgxe19OcubqV5w
April 1, 2024
191926
Malta
MLT
true
2
1
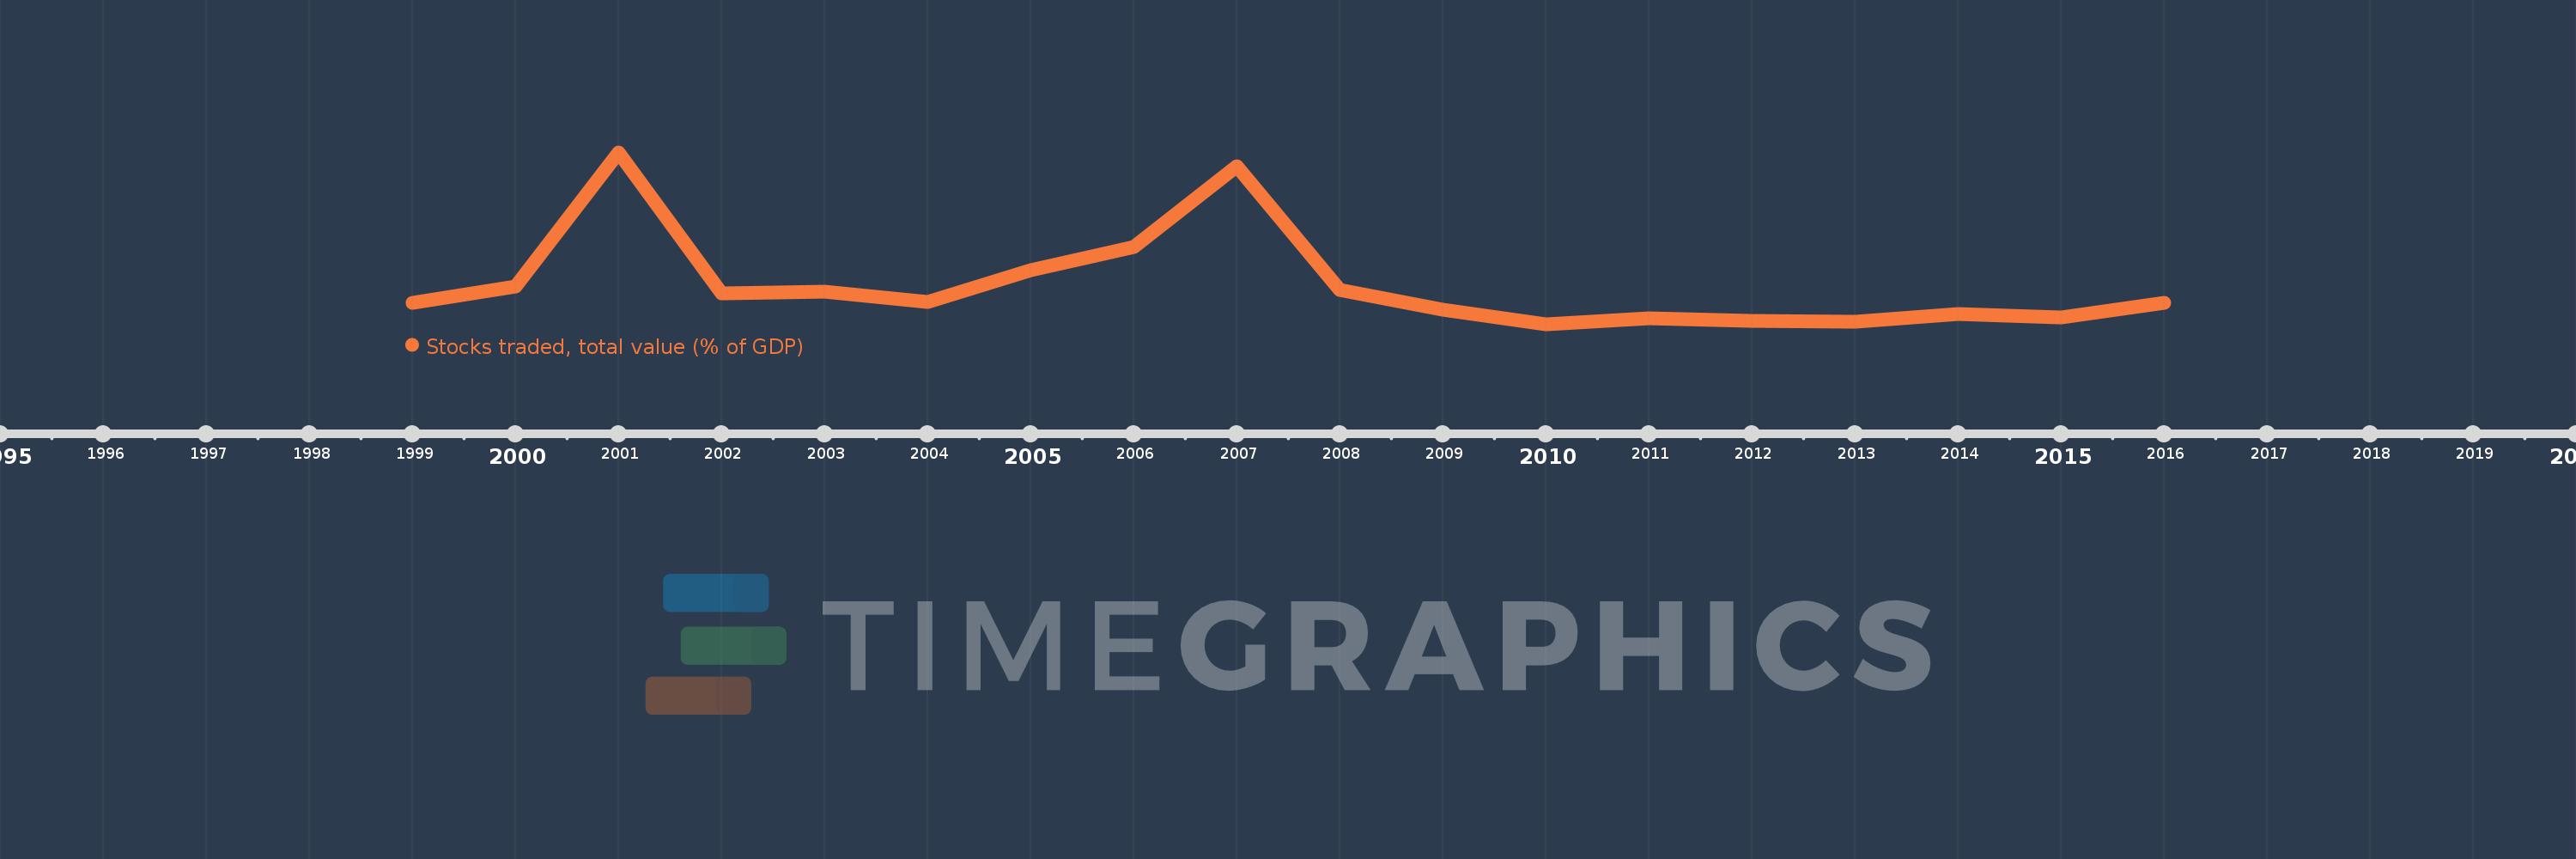
Stocks traded, total value (% of GDP)
2016,2015,2014,2013,2012,2011,2010,2009,2008,2007,2006,2005,2004,2003,2002,2001,2000,1999
Cette statistique dans les autres pays:
La ligne de temps
Cette échelle de temps montre un graphique de 1999 année à 2016 année Malta. Les données jusqu'à 1998 année ne sont pas présentés. Quantité d'observations actuelles selon dates: 18.
Source (désignation):
Les indicateurs du développement mondiale
Source (organisation):
World Federation of Exchanges database.
Catégories:
Financial Sector
Dernière mise à jour
23 avr. 2017
Les indicateurs de changement de valeurs selon les années
Minimum:
0.428
1 janv. 2010
Maximum:
4.317
1 janv. 2001
Pour la date d''observation
Valeur
Changement absolu
Le changement par rapport à la valeur précédente
1 janv. 1999
0.903
+0.903
0.0%
1 janv. 2000
1.277
+0.374
41.44%
1 janv. 2001
4.317
+3.04
238.12%
1 janv. 2002
1.128
-3.189
-73.87%
1 janv. 2003
1.17
+0.042
3.69%
1 janv. 2004
0.937
-0.233
-19.91%
1 janv. 2005
1.66
+0.724
77.26%
1 janv. 2006
2.181
+0.521
31.37%
1 janv. 2007
4.003
+1.822
83.55%
1 janv. 2008
1.2
-2.803
-70.02%
1 janv. 2009
0.758
-0.442
-36.81%
1 janv. 2010
0.428
-0.331
-43.62%
1 janv. 2011
0.556
+0.128
29.91%
1 janv. 2012
0.51
-0.045
-8.14%
1 janv. 2013
0.476
-0.034
-6.72%
1 janv. 2014
0.661
+0.185
38.94%
1 janv. 2015
0.572
-0.089
-13.45%
1 janv. 2016
0.911
+0.339
59.18%
Classement des pays selon les statistiques actuelles par années


Commentaires: