29
/fr/
fr
AIzaSyAYiBZKx7MnpbEhh9jyipgxe19OcubqV5w
April 1, 2024
72778
Australia
AUS
true
2
1
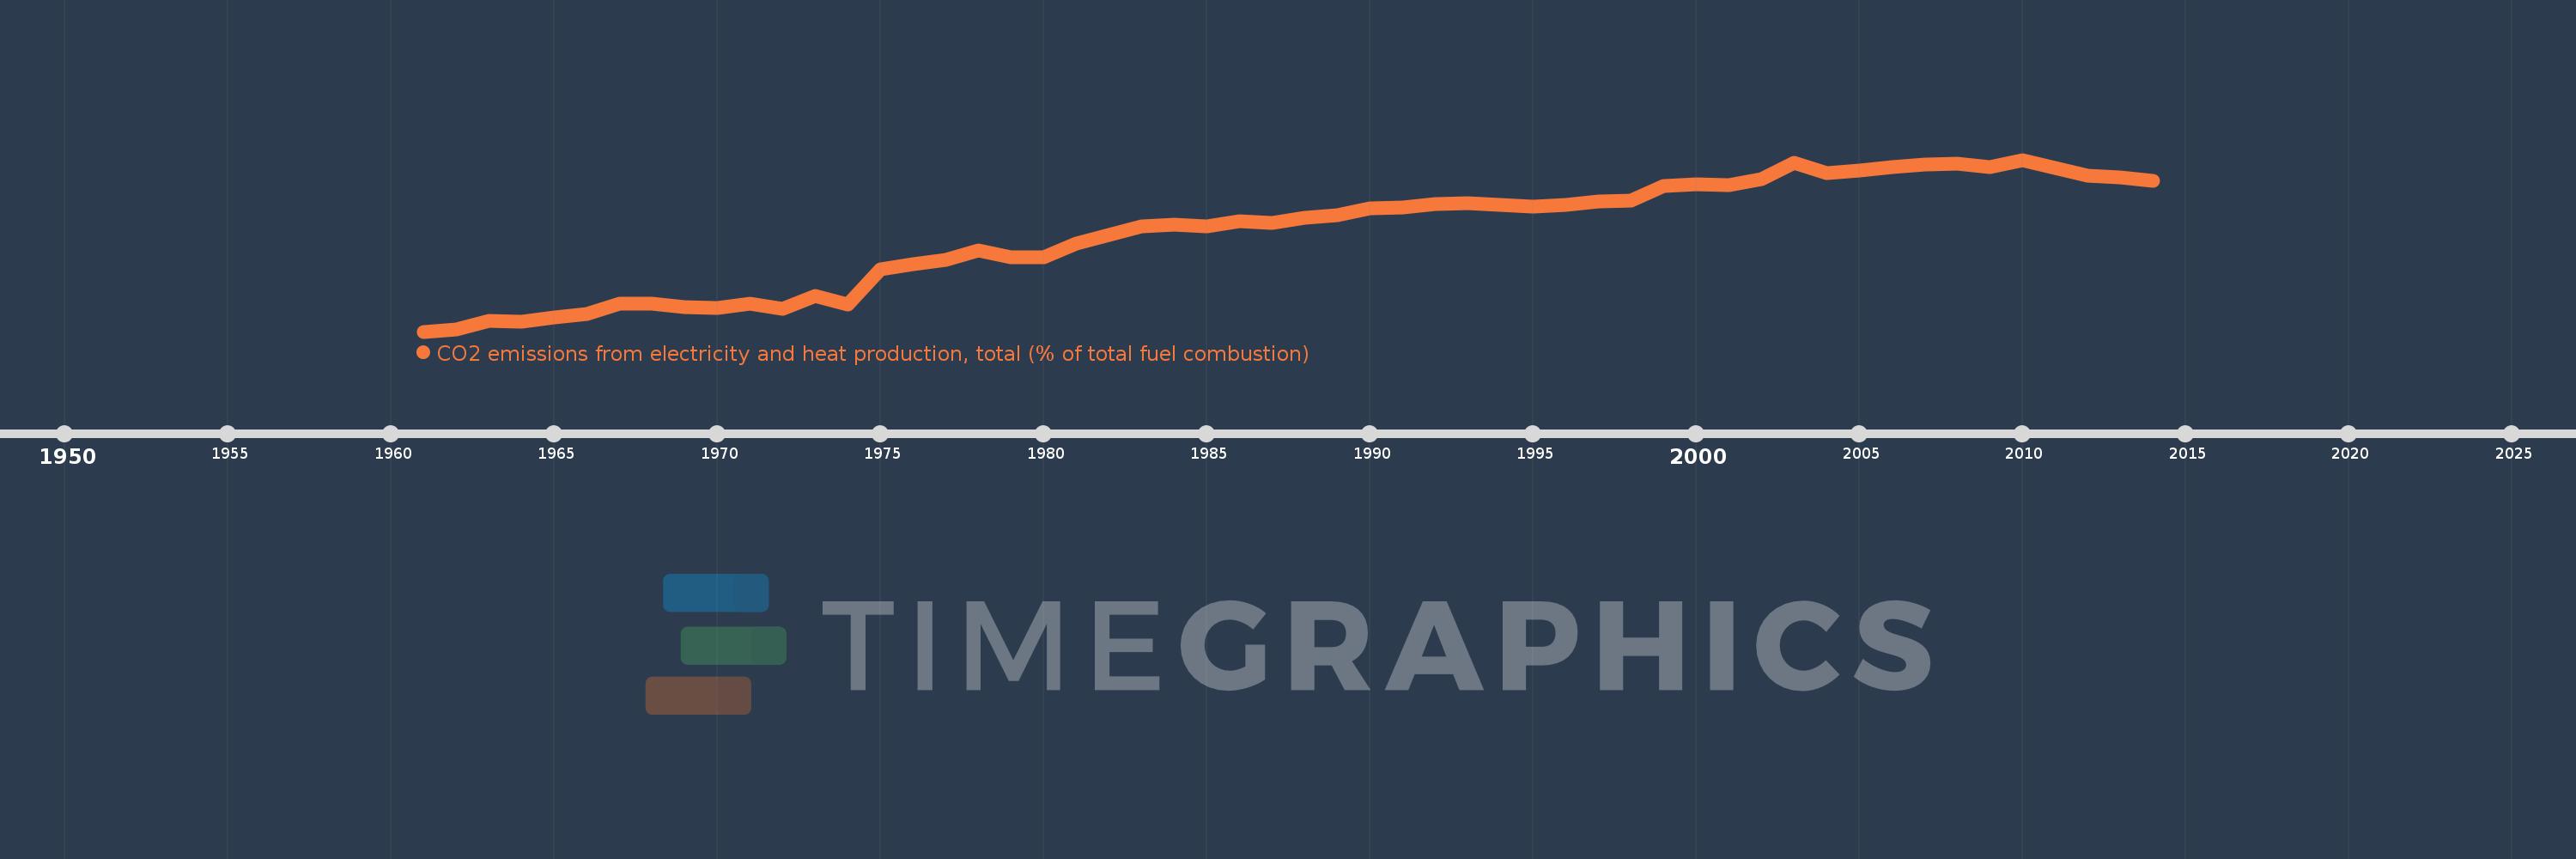
CO2 emissions from electricity and heat production, total (% of total fuel combustion)
2014,2013,2012,2011,2010,2009,2008,2007,2006,2005,2004,2003,2002,2001,2000,1999,1998,1997,1996,1995,1994,1993,1992,1991,1990,1989,1988,1987,1986,1985,1984,1983,1982,1981,1980,1979,1978,1977,1976,1975,1974,1973,1972,1971,1970,1969,1968,1967,1966,1965,1964,1963,1962,1961
Cette statistique dans les autres pays:
AlbaniaAlgeriaAngolaArab WorldArgentinaArmeniaAustraliaAustriaAzerbaijanBahrainBangladeshBelarusBelgiumBeninBoliviaBosnia and HerzegovinaBotswanaBrazilBrunei DarussalamBulgariaCambodiaCameroonCanadaCaribbean small statesCentral Europe and the BalticsChileChinaColombiaCongo, Dem. Rep.Congo, Rep.Costa RicaCote d'IvoireCroatiaCubaCuracaoCyprusCzech RepublicDenmarkDominican RepublicEarly-demographic dividendEast Asia & PacificEast Asia & Pacific (excluding high income)East Asia & Pacific (IDA & IBRD countries)EcuadorEgypt, Arab Rep.El SalvadorEritreaEstoniaEthiopiaEuro areaEurope & Central AsiaEurope & Central Asia (excluding high income)Europe & Central Asia (IDA & IBRD countries)European UnionFinlandFragile and conflict affected situationsFranceGabonGeorgiaGermanyGhanaGibraltarGreeceGuatemalaHaitiHeavily indebted poor countries (HIPC)High incomeHondurasHong Kong SAR, ChinaHungaryIBRD onlyIcelandIDA & IBRD totalIDA blendIDA onlyIDA totalIndiaIndonesiaIran, Islamic Rep.IraqIrelandIsraelItalyJamaicaJapanJordanKazakhstanKenyaKorea, Dem. People’s Rep.Korea, Rep.KosovoKuwaitKyrgyz RepublicLate-demographic dividendLatin America & Caribbean Latin America & Caribbean (excluding high income)Latin America & the Caribbean (IDA & IBRD countries)LatviaLeast developed countries: UN classificationLebanonLibyaLithuaniaLow & middle incomeLow incomeLower middle incomeLuxembourgMacedonia, FYRMalaysiaMaltaMauritiusMexicoMiddle East & North AfricaMiddle East & North Africa (excluding high income)Middle East & North Africa (IDA & IBRD countries)Middle incomeMoldovaMongoliaMontenegroMoroccoMozambiqueMyanmarNamibiaNepalNetherlandsNew ZealandNicaraguaNigerNigeriaNorth AmericaNorwayOECD membersOmanOther small statesPakistanPanamaParaguayPeruPhilippinesPolandPortugalPost-demographic dividendPre-demographic dividendQatarRomaniaRussian FederationSaudi ArabiaSenegalSerbiaSingaporeSlovak RepublicSloveniaSmall statesSouth AfricaSouth AsiaSouth Asia (IDA & IBRD)South SudanSpainSri LankaSub-Saharan Africa Sub-Saharan Africa (excluding high income)Sub-Saharan Africa (IDA & IBRD countries)SudanSwedenSwitzerlandSyrian Arab RepublicTajikistanTanzaniaThailandTogoTrinidad and TobagoTunisiaTurkeyTurkmenistanUkraineUnited Arab EmiratesUnited KingdomUnited StatesUpper middle incomeUruguayUzbekistanVenezuela, RBVietnamWorldYemen, Rep.ZambiaZimbabwe La ligne de temps
Cette échelle de temps montre un graphique de 1961 année à 2014 année Australia. Les données jusqu'à 1960 année ne sont pas présentés. Quantité d'observations actuelles selon dates: 54.
Source (désignation):
Les indicateurs du développement mondiale
Source (organisation):
IEA Statistics © OECD/IEA 2014 (http://www.iea.org/stats/index.asp), subject to https://www.iea.org/t&c/termsandconditions/
Catégories:
Environment
Dernière mise à jour
23 avr. 2017
Les indicateurs de changement de valeurs selon les années
Minimum:
33.872
1 janv. 1961
Maximum:
63.172
1 janv. 2010
Pour la date d''observation
Valeur
Changement absolu
Le changement par rapport à la valeur précédente
1 janv. 1961
33.872
+33.872
0.0%
1 janv. 1962
34.284
+0.412
1.22%
1 janv. 1963
35.691
+1.407
4.1%
1 janv. 1964
35.582
-0.109
-0.3%
1 janv. 1965
36.271
+0.689
1.94%
1 janv. 1966
36.888
+0.617
1.7%
1 janv. 1967
38.647
+1.759
4.77%
1 janv. 1968
38.568
-0.079
-0.2%
1 janv. 1969
38.093
-0.475
-1.23%
1 janv. 1970
37.939
-0.155
-0.41%
1 janv. 1971
38.594
+0.655
1.73%
1 janv. 1972
37.758
-0.835
-2.16%
1 janv. 1973
39.957
+2.199
5.82%
1 janv. 1974
38.499
-1.458
-3.65%
1 janv. 1975
44.549
+6.05
15.72%
1 janv. 1976
45.433
+0.884
1.99%
1 janv. 1977
46.096
+0.663
1.46%
1 janv. 1978
47.655
+1.558
3.38%
1 janv. 1979
46.528
-1.127
-2.36%
1 janv. 1980
46.524
-0.003
-0.01%
1 janv. 1981
48.858
+2.334
5.02%
1 janv. 1982
50.412
+1.554
3.18%
1 janv. 1983
51.87
+1.457
2.89%
1 janv. 1984
52.106
+0.237
0.46%
1 janv. 1985
51.778
-0.328
-0.63%
1 janv. 1986
52.737
+0.958
1.85%
1 janv. 1987
52.356
-0.38
-0.72%
1 janv. 1988
53.334
+0.978
1.87%
1 janv. 1989
53.752
+0.417
0.78%
1 janv. 1990
54.831
+1.079
2.01%
1 janv. 1991
54.976
+0.145
0.26%
1 janv. 1992
55.664
+0.688
1.25%
1 janv. 1993
55.738
+0.074
0.13%
1 janv. 1994
55.456
-0.282
-0.51%
1 janv. 1995
55.248
-0.207
-0.37%
1 janv. 1996
55.411
+0.163
0.29%
1 janv. 1997
56.01
+0.599
1.08%
1 janv. 1998
56.141
+0.131
0.23%
1 janv. 1999
58.672
+2.531
4.51%
1 janv. 2000
59.056
+0.383
0.65%
1 janv. 2001
58.85
-0.206
-0.35%
1 janv. 2002
59.918
+1.069
1.82%
1 janv. 2003
62.682
+2.763
4.61%
1 janv. 2004
60.942
-1.739
-2.77%
1 janv. 2005
61.399
+0.457
0.75%
1 janv. 2006
61.91
+0.511
0.83%
1 janv. 2007
62.415
+0.505
0.82%
1 janv. 2008
62.568
+0.153
0.25%
1 janv. 2009
61.946
-0.622
-0.99%
1 janv. 2010
63.172
+1.225
1.98%
1 janv. 2011
61.748
-1.424
-2.25%
1 janv. 2012
60.456
-1.292
-2.09%
1 janv. 2013
60.206
-0.249
-0.41%
1 janv. 2014
59.555
-0.651
-1.08%
Classement des pays selon les statistiques actuelles par années


Commentaires: