29
/fr/
fr
AIzaSyAYiBZKx7MnpbEhh9jyipgxe19OcubqV5w
April 1, 2024
148914
Haiti
HTI
true
2
1
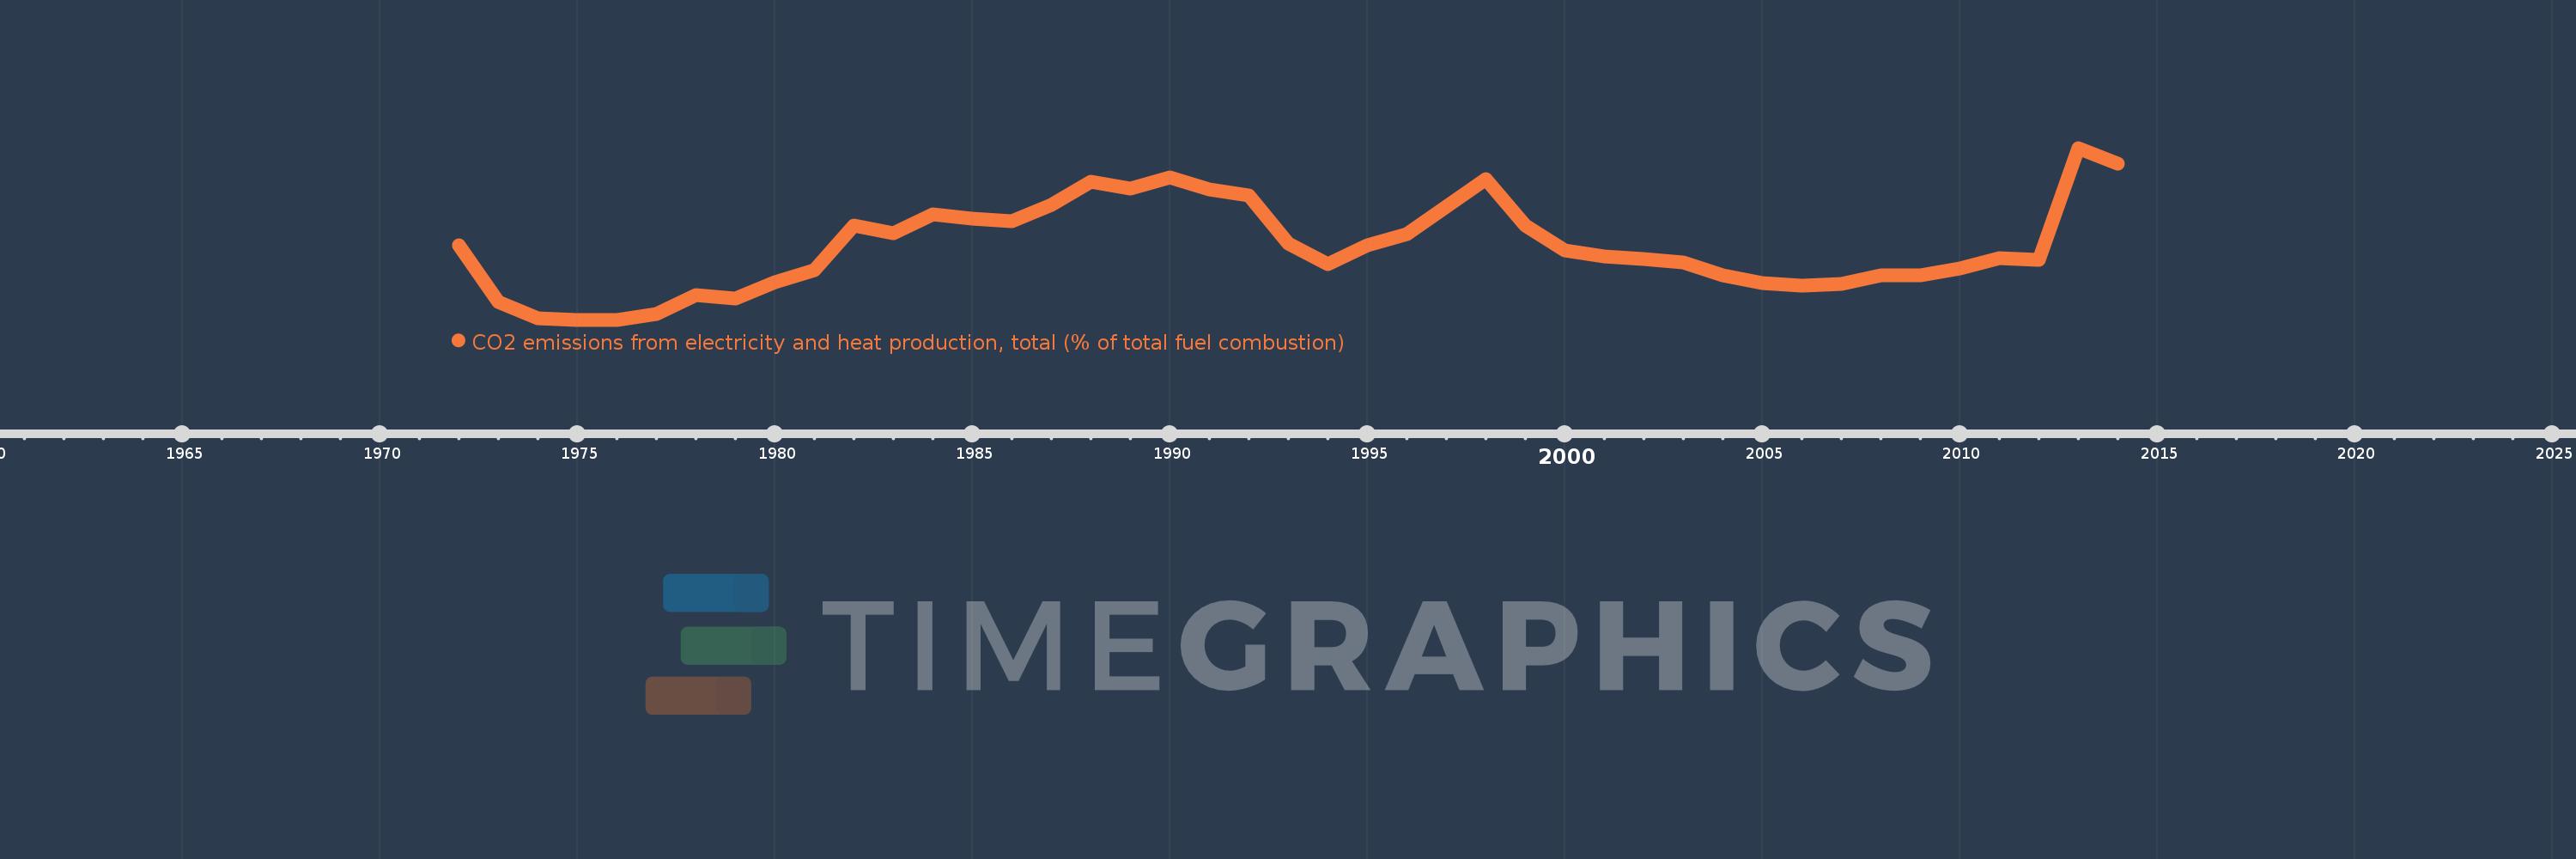
CO2 emissions from electricity and heat production, total (% of total fuel combustion)
2014,2013,2012,2011,2010,2009,2008,2007,2006,2005,2004,2003,2002,2001,2000,1999,1998,1997,1996,1995,1994,1993,1992,1991,1990,1989,1988,1987,1986,1985,1984,1983,1982,1981,1980,1979,1978,1977,1976,1975,1974,1973,1972
Cette statistique dans les autres pays:
AlbaniaAlgeriaAngolaArab WorldArgentinaArmeniaAustraliaAustriaAzerbaijanBahrainBangladeshBelarusBelgiumBeninBoliviaBosnia and HerzegovinaBotswanaBrazilBrunei DarussalamBulgariaCambodiaCameroonCanadaCaribbean small statesCentral Europe and the BalticsChileChinaColombiaCongo, Dem. Rep.Congo, Rep.Costa RicaCote d'IvoireCroatiaCubaCuracaoCyprusCzech RepublicDenmarkDominican RepublicEarly-demographic dividendEast Asia & PacificEast Asia & Pacific (excluding high income)East Asia & Pacific (IDA & IBRD countries)EcuadorEgypt, Arab Rep.El SalvadorEritreaEstoniaEthiopiaEuro areaEurope & Central AsiaEurope & Central Asia (excluding high income)Europe & Central Asia (IDA & IBRD countries)European UnionFinlandFragile and conflict affected situationsFranceGabonGeorgiaGermanyGhanaGibraltarGreeceGuatemalaHaitiHeavily indebted poor countries (HIPC)High incomeHondurasHong Kong SAR, ChinaHungaryIBRD onlyIcelandIDA & IBRD totalIDA blendIDA onlyIDA totalIndiaIndonesiaIran, Islamic Rep.IraqIrelandIsraelItalyJamaicaJapanJordanKazakhstanKenyaKorea, Dem. People’s Rep.Korea, Rep.KosovoKuwaitKyrgyz RepublicLate-demographic dividendLatin America & Caribbean Latin America & Caribbean (excluding high income)Latin America & the Caribbean (IDA & IBRD countries)LatviaLeast developed countries: UN classificationLebanonLibyaLithuaniaLow & middle incomeLow incomeLower middle incomeLuxembourgMacedonia, FYRMalaysiaMaltaMauritiusMexicoMiddle East & North AfricaMiddle East & North Africa (excluding high income)Middle East & North Africa (IDA & IBRD countries)Middle incomeMoldovaMongoliaMontenegroMoroccoMozambiqueMyanmarNamibiaNepalNetherlandsNew ZealandNicaraguaNigerNigeriaNorth AmericaNorwayOECD membersOmanOther small statesPakistanPanamaParaguayPeruPhilippinesPolandPortugalPost-demographic dividendPre-demographic dividendQatarRomaniaRussian FederationSaudi ArabiaSenegalSerbiaSingaporeSlovak RepublicSloveniaSmall statesSouth AfricaSouth AsiaSouth Asia (IDA & IBRD)South SudanSpainSri LankaSub-Saharan Africa Sub-Saharan Africa (excluding high income)Sub-Saharan Africa (IDA & IBRD countries)SudanSwedenSwitzerlandSyrian Arab RepublicTajikistanTanzaniaThailandTogoTrinidad and TobagoTunisiaTurkeyTurkmenistanUkraineUnited Arab EmiratesUnited KingdomUnited StatesUpper middle incomeUruguayUzbekistanVenezuela, RBVietnamWorldYemen, Rep.ZambiaZimbabwe La ligne de temps
Cette échelle de temps montre un graphique de 1972 année à 2014 année Haiti. Les données jusqu'à 1971 année ne sont pas présentés. Quantité d'observations actuelles selon dates: 43.
Source (désignation):
Les indicateurs du développement mondiale
Source (organisation):
IEA Statistics © OECD/IEA 2014 (http://www.iea.org/stats/index.asp), subject to https://www.iea.org/t&c/termsandconditions/
Catégories:
Environment
Dernière mise à jour
23 avr. 2017
Les indicateurs de changement de valeurs selon les années
Minimum:
2.439
1 janv. 1975
Maximum:
33.173
1 janv. 2013
Pour la date d''observation
Valeur
Changement absolu
Le changement par rapport à la valeur précédente
1 janv. 1972
15.789
+15.789
0.0%
1 janv. 1973
5.556
-10.234
-64.81%
1 janv. 1974
2.703
-2.853
-51.35%
1 janv. 1975
2.439
-0.264
-9.76%
1 janv. 1976
2.439
0.0
0.0%
1 janv. 1977
3.509
+1.07
43.86%
1 janv. 1978
6.78
+3.271
93.22%
1 janv. 1979
6.25
-0.53
-7.81%
1 janv. 1980
9.231
+2.981
47.69%
1 janv. 1981
11.29
+2.06
22.31%
1 janv. 1982
19.231
+7.94
70.33%
1 janv. 1983
17.91
-1.32
-6.87%
1 janv. 1984
21.333
+3.423
19.11%
1 janv. 1985
20.513
-0.821
-3.85%
1 janv. 1986
20.0
-0.513
-2.5%
1 janv. 1987
22.973
+2.973
14.86%
1 janv. 1988
27.16
+4.188
18.23%
1 janv. 1989
25.843
-1.318
-4.85%
1 janv. 1990
27.957
+2.114
8.18%
1 janv. 1991
25.806
-2.151
-7.69%
1 janv. 1992
24.719
-1.087
-4.21%
1 janv. 1993
16.049
-8.67
-35.07%
1 janv. 1994
12.308
-3.742
-23.31%
1 janv. 1995
15.789
+3.482
28.29%
1 janv. 1996
17.778
+1.988
12.59%
1 janv. 1997
22.642
+4.864
27.36%
1 janv. 1998
27.559
+4.918
21.72%
1 janv. 1999
19.231
-8.328
-30.22%
1 janv. 2000
14.815
-4.416
-22.96%
1 janv. 2001
13.768
-1.047
-7.07%
1 janv. 2002
13.245
-0.523
-3.8%
1 janv. 2003
12.717
-0.528
-3.99%
1 janv. 2004
10.366
-2.351
-18.49%
1 janv. 2005
8.995
-1.371
-13.23%
1 janv. 2006
8.586
-0.409
-4.55%
1 janv. 2007
8.911
+0.325
3.79%
1 janv. 2008
10.345
+1.434
16.09%
1 janv. 2009
10.345
0.0
0.0%
1 janv. 2010
11.607
+1.262
12.2%
1 janv. 2011
13.397
+1.79
15.42%
1 janv. 2012
13.084
-0.313
-2.34%
1 janv. 2013
33.173
+20.089
153.54%
1 janv. 2014
30.415
-2.758
-8.31%
Classement des pays selon les statistiques actuelles par années


Commentaires: