29
/fr/
fr
AIzaSyAYiBZKx7MnpbEhh9jyipgxe19OcubqV5w
April 1, 2024
261984
Thailand
THA
true
2
1
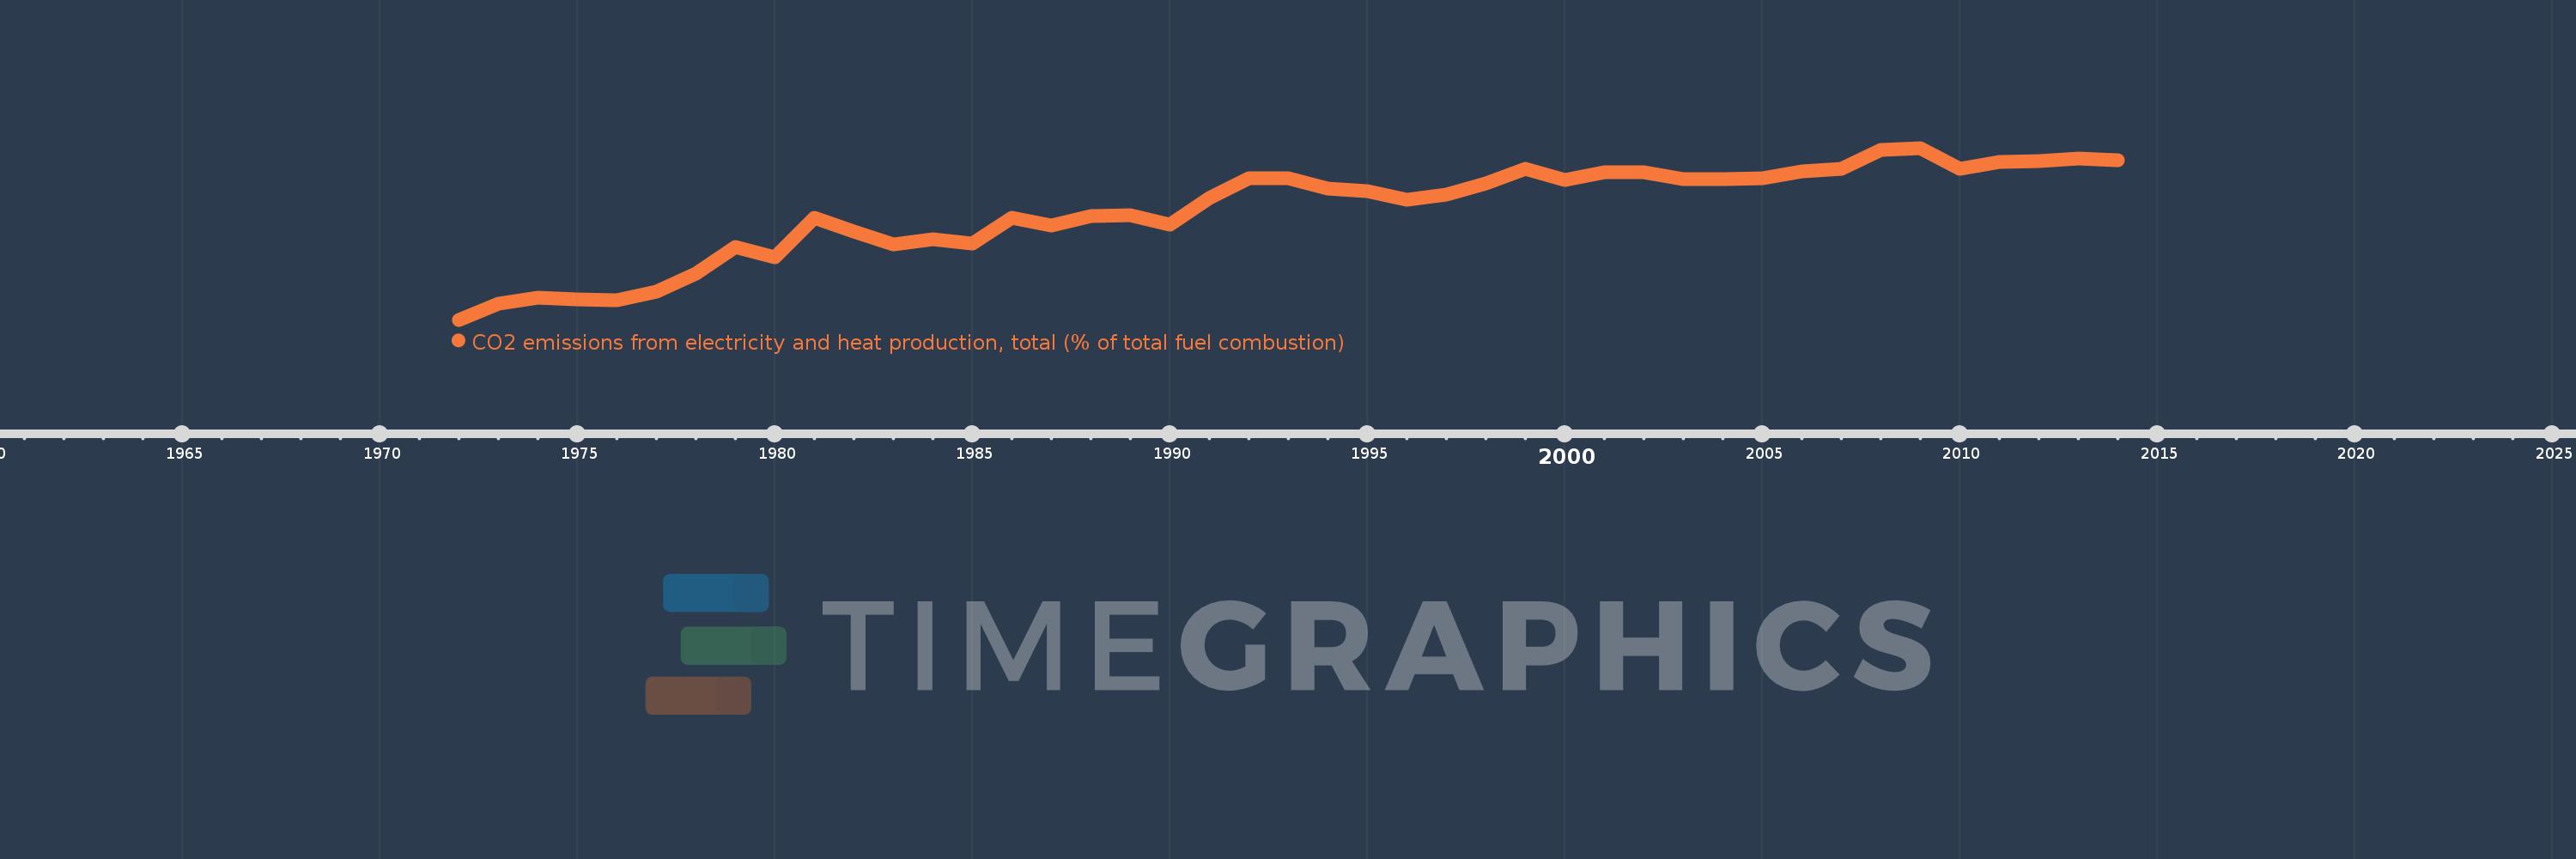
CO2 emissions from electricity and heat production, total (% of total fuel combustion)
2014,2013,2012,2011,2010,2009,2008,2007,2006,2005,2004,2003,2002,2001,2000,1999,1998,1997,1996,1995,1994,1993,1992,1991,1990,1989,1988,1987,1986,1985,1984,1983,1982,1981,1980,1979,1978,1977,1976,1975,1974,1973,1972
Cette statistique dans les autres pays:
AlbaniaAlgeriaAngolaArab WorldArgentinaArmeniaAustraliaAustriaAzerbaijanBahrainBangladeshBelarusBelgiumBeninBoliviaBosnia and HerzegovinaBotswanaBrazilBrunei DarussalamBulgariaCambodiaCameroonCanadaCaribbean small statesCentral Europe and the BalticsChileChinaColombiaCongo, Dem. Rep.Congo, Rep.Costa RicaCote d'IvoireCroatiaCubaCuracaoCyprusCzech RepublicDenmarkDominican RepublicEarly-demographic dividendEast Asia & PacificEast Asia & Pacific (excluding high income)East Asia & Pacific (IDA & IBRD countries)EcuadorEgypt, Arab Rep.El SalvadorEritreaEstoniaEthiopiaEuro areaEurope & Central AsiaEurope & Central Asia (excluding high income)Europe & Central Asia (IDA & IBRD countries)European UnionFinlandFragile and conflict affected situationsFranceGabonGeorgiaGermanyGhanaGibraltarGreeceGuatemalaHaitiHeavily indebted poor countries (HIPC)High incomeHondurasHong Kong SAR, ChinaHungaryIBRD onlyIcelandIDA & IBRD totalIDA blendIDA onlyIDA totalIndiaIndonesiaIran, Islamic Rep.IraqIrelandIsraelItalyJamaicaJapanJordanKazakhstanKenyaKorea, Dem. People’s Rep.Korea, Rep.KosovoKuwaitKyrgyz RepublicLate-demographic dividendLatin America & Caribbean Latin America & Caribbean (excluding high income)Latin America & the Caribbean (IDA & IBRD countries)LatviaLeast developed countries: UN classificationLebanonLibyaLithuaniaLow & middle incomeLow incomeLower middle incomeLuxembourgMacedonia, FYRMalaysiaMaltaMauritiusMexicoMiddle East & North AfricaMiddle East & North Africa (excluding high income)Middle East & North Africa (IDA & IBRD countries)Middle incomeMoldovaMongoliaMontenegroMoroccoMozambiqueMyanmarNamibiaNepalNetherlandsNew ZealandNicaraguaNigerNigeriaNorth AmericaNorwayOECD membersOmanOther small statesPakistanPanamaParaguayPeruPhilippinesPolandPortugalPost-demographic dividendPre-demographic dividendQatarRomaniaRussian FederationSaudi ArabiaSenegalSerbiaSingaporeSlovak RepublicSloveniaSmall statesSouth AfricaSouth AsiaSouth Asia (IDA & IBRD)South SudanSpainSri LankaSub-Saharan Africa Sub-Saharan Africa (excluding high income)Sub-Saharan Africa (IDA & IBRD countries)SudanSwedenSwitzerlandSyrian Arab RepublicTajikistanTanzaniaThailandTogoTrinidad and TobagoTunisiaTurkeyTurkmenistanUkraineUnited Arab EmiratesUnited KingdomUnited StatesUpper middle incomeUruguayUzbekistanVenezuela, RBVietnamWorldYemen, Rep.ZambiaZimbabwe La ligne de temps
Cette échelle de temps montre un graphique de 1972 année à 2014 année Thailand. Les données jusqu'à 1971 année ne sont pas présentés. Quantité d'observations actuelles selon dates: 43.
Source (désignation):
Les indicateurs du développement mondiale
Source (organisation):
IEA Statistics © OECD/IEA 2014 (http://www.iea.org/stats/index.asp), subject to https://www.iea.org/t&c/termsandconditions/
Catégories:
Environment
Dernière mise à jour
23 avr. 2017
Les indicateurs de changement de valeurs selon les années
Minimum:
18.35
1 janv. 1972
Maximum:
46.136
1 janv. 2009
Pour la date d''observation
Valeur
Changement absolu
Le changement par rapport à la valeur précédente
1 janv. 1972
18.35
+18.35
0.0%
1 janv. 1973
20.963
+2.614
14.24%
1 janv. 1974
21.873
+0.91
4.34%
1 janv. 1975
21.705
-0.168
-0.77%
1 janv. 1976
21.523
-0.182
-0.84%
1 janv. 1977
22.854
+1.33
6.18%
1 janv. 1978
25.804
+2.95
12.91%
1 janv. 1979
30.133
+4.329
16.78%
1 janv. 1980
28.429
-1.704
-5.66%
1 janv. 1981
34.776
+6.347
22.33%
1 janv. 1982
32.565
-2.211
-6.36%
1 janv. 1983
30.591
-1.974
-6.06%
1 janv. 1984
31.31
+0.718
2.35%
1 janv. 1985
30.692
-0.617
-1.97%
1 janv. 1986
34.784
+4.091
13.33%
1 janv. 1987
33.656
-1.128
-3.24%
1 janv. 1988
35.1
+1.444
4.29%
1 janv. 1989
35.3
+0.2
0.57%
1 janv. 1990
33.666
-1.635
-4.63%
1 janv. 1991
38.027
+4.361
12.95%
1 janv. 1992
41.235
+3.208
8.44%
1 janv. 1993
41.251
+0.015
0.04%
1 janv. 1994
39.608
-1.643
-3.98%
1 janv. 1995
39.148
-0.459
-1.16%
1 janv. 1996
37.792
-1.356
-3.46%
1 janv. 1997
38.548
+0.756
2.0%
1 janv. 1998
40.452
+1.905
4.94%
1 janv. 1999
42.769
+2.317
5.73%
1 janv. 2000
41.007
-1.762
-4.12%
1 janv. 2001
42.209
+1.202
2.93%
1 janv. 2002
42.225
+0.016
0.04%
1 janv. 2003
41.137
-1.088
-2.58%
1 janv. 2004
41.104
-0.032
-0.08%
1 janv. 2005
41.241
+0.137
0.33%
1 janv. 2006
42.283
+1.041
2.52%
1 janv. 2007
42.822
+0.54
1.28%
1 janv. 2008
45.865
+3.043
7.11%
1 janv. 2009
46.136
+0.27
0.59%
1 janv. 2010
42.775
-3.361
-7.28%
1 janv. 2011
43.892
+1.117
2.61%
1 janv. 2012
44.066
+0.174
0.4%
1 janv. 2013
44.434
+0.368
0.84%
1 janv. 2014
44.13
-0.304
-0.68%
Classement des pays selon les statistiques actuelles par années


Commentaires: