29
/fr/
fr
AIzaSyAYiBZKx7MnpbEhh9jyipgxe19OcubqV5w
April 1, 2024
276450
United States
USA
true
2
1
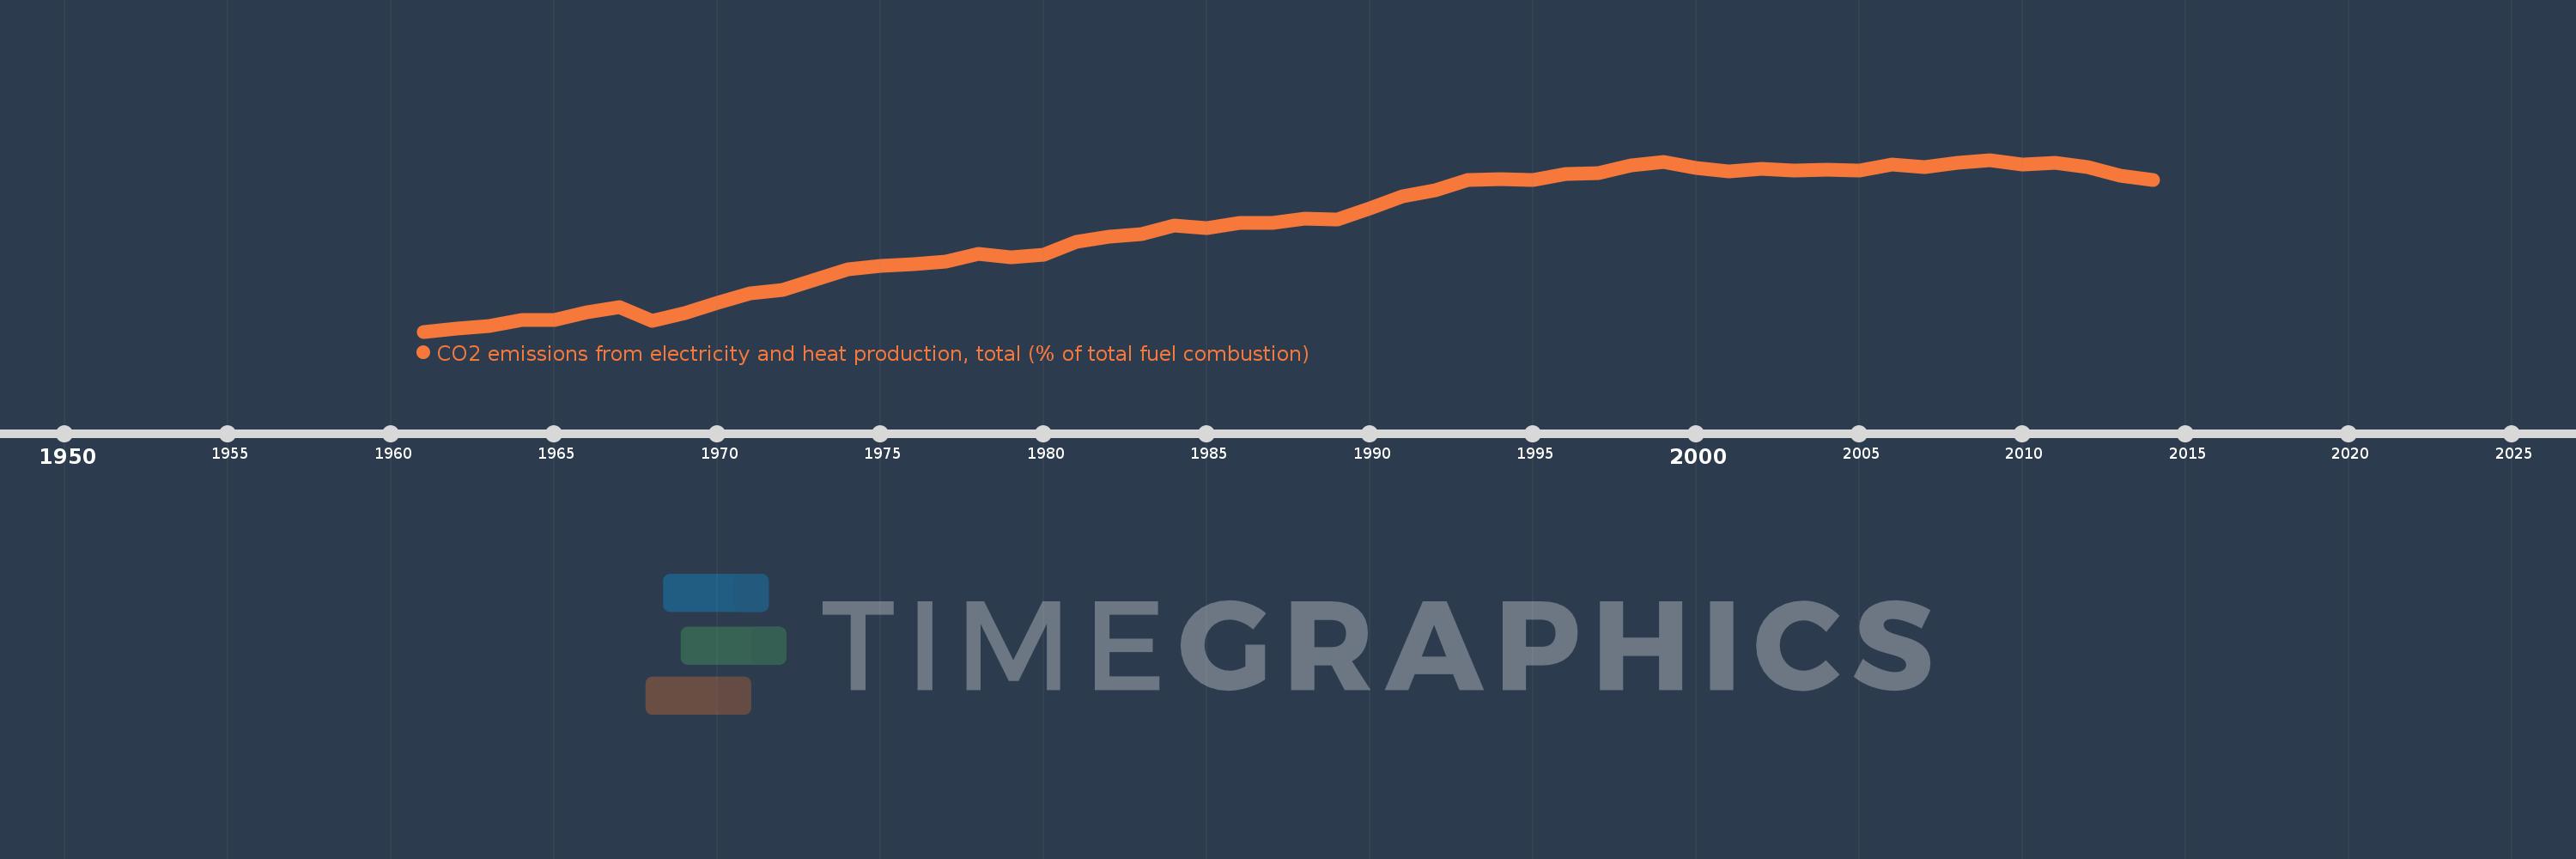
CO2 emissions from electricity and heat production, total (% of total fuel combustion)
2014,2013,2012,2011,2010,2009,2008,2007,2006,2005,2004,2003,2002,2001,2000,1999,1998,1997,1996,1995,1994,1993,1992,1991,1990,1989,1988,1987,1986,1985,1984,1983,1982,1981,1980,1979,1978,1977,1976,1975,1974,1973,1972,1971,1970,1969,1968,1967,1966,1965,1964,1963,1962,1961
Cette statistique dans les autres pays:
AlbaniaAlgeriaAngolaArab WorldArgentinaArmeniaAustraliaAustriaAzerbaijanBahrainBangladeshBelarusBelgiumBeninBoliviaBosnia and HerzegovinaBotswanaBrazilBrunei DarussalamBulgariaCambodiaCameroonCanadaCaribbean small statesCentral Europe and the BalticsChileChinaColombiaCongo, Dem. Rep.Congo, Rep.Costa RicaCote d'IvoireCroatiaCubaCuracaoCyprusCzech RepublicDenmarkDominican RepublicEarly-demographic dividendEast Asia & PacificEast Asia & Pacific (excluding high income)East Asia & Pacific (IDA & IBRD countries)EcuadorEgypt, Arab Rep.El SalvadorEritreaEstoniaEthiopiaEuro areaEurope & Central AsiaEurope & Central Asia (excluding high income)Europe & Central Asia (IDA & IBRD countries)European UnionFinlandFragile and conflict affected situationsFranceGabonGeorgiaGermanyGhanaGibraltarGreeceGuatemalaHaitiHeavily indebted poor countries (HIPC)High incomeHondurasHong Kong SAR, ChinaHungaryIBRD onlyIcelandIDA & IBRD totalIDA blendIDA onlyIDA totalIndiaIndonesiaIran, Islamic Rep.IraqIrelandIsraelItalyJamaicaJapanJordanKazakhstanKenyaKorea, Dem. People’s Rep.Korea, Rep.KosovoKuwaitKyrgyz RepublicLate-demographic dividendLatin America & Caribbean Latin America & Caribbean (excluding high income)Latin America & the Caribbean (IDA & IBRD countries)LatviaLeast developed countries: UN classificationLebanonLibyaLithuaniaLow & middle incomeLow incomeLower middle incomeLuxembourgMacedonia, FYRMalaysiaMaltaMauritiusMexicoMiddle East & North AfricaMiddle East & North Africa (excluding high income)Middle East & North Africa (IDA & IBRD countries)Middle incomeMoldovaMongoliaMontenegroMoroccoMozambiqueMyanmarNamibiaNepalNetherlandsNew ZealandNicaraguaNigerNigeriaNorth AmericaNorwayOECD membersOmanOther small statesPakistanPanamaParaguayPeruPhilippinesPolandPortugalPost-demographic dividendPre-demographic dividendQatarRomaniaRussian FederationSaudi ArabiaSenegalSerbiaSingaporeSlovak RepublicSloveniaSmall statesSouth AfricaSouth AsiaSouth Asia (IDA & IBRD)South SudanSpainSri LankaSub-Saharan Africa Sub-Saharan Africa (excluding high income)Sub-Saharan Africa (IDA & IBRD countries)SudanSwedenSwitzerlandSyrian Arab RepublicTajikistanTanzaniaThailandTogoTrinidad and TobagoTunisiaTurkeyTurkmenistanUkraineUnited Arab EmiratesUnited KingdomUnited StatesUpper middle incomeUruguayUzbekistanVenezuela, RBVietnamWorldYemen, Rep.ZambiaZimbabwe La ligne de temps
Cette échelle de temps montre un graphique de 1961 année à 2014 année United States. Les données jusqu'à 1960 année ne sont pas présentés. Quantité d'observations actuelles selon dates: 54.
Source (désignation):
Les indicateurs du développement mondiale
Source (organisation):
IEA Statistics © OECD/IEA 2014 (http://www.iea.org/stats/index.asp), subject to https://www.iea.org/t&c/termsandconditions/
Catégories:
Environment
Dernière mise à jour
23 avr. 2017
Les indicateurs de changement de valeurs selon les années
Minimum:
27.635
1 janv. 1961
Maximum:
49.624
1 janv. 2009
Pour la date d''observation
Valeur
Changement absolu
Le changement par rapport à la valeur précédente
1 janv. 1961
27.635
+27.635
0.0%
1 janv. 1962
28.017
+0.382
1.38%
1 janv. 1963
28.325
+0.308
1.1%
1 janv. 1964
29.128
+0.803
2.83%
1 janv. 1965
29.139
+0.011
0.04%
1 janv. 1966
30.136
+0.998
3.42%
1 janv. 1967
30.743
+0.607
2.01%
1 janv. 1968
29.022
-1.721
-5.6%
1 janv. 1969
30.027
+1.004
3.46%
1 janv. 1970
31.366
+1.339
4.46%
1 janv. 1971
32.487
+1.121
3.57%
1 janv. 1972
33.0
+0.513
1.58%
1 janv. 1973
34.306
+1.306
3.96%
1 janv. 1974
35.552
+1.245
3.63%
1 janv. 1975
36.054
+0.502
1.41%
1 janv. 1976
36.282
+0.229
0.63%
1 janv. 1977
36.589
+0.307
0.85%
1 janv. 1978
37.608
+1.018
2.78%
1 janv. 1979
37.186
-0.422
-1.12%
1 janv. 1980
37.492
+0.306
0.82%
1 janv. 1981
39.082
+1.59
4.24%
1 janv. 1982
39.782
+0.7
1.79%
1 janv. 1983
40.131
+0.349
0.88%
1 janv. 1984
41.186
+1.056
2.63%
1 janv. 1985
40.9
-0.287
-0.7%
1 janv. 1986
41.534
+0.634
1.55%
1 janv. 1987
41.558
+0.024
0.06%
1 janv. 1988
42.043
+0.484
1.17%
1 janv. 1989
41.97
-0.072
-0.17%
1 janv. 1990
43.39
+1.42
3.38%
1 janv. 1991
44.971
+1.58
3.64%
1 janv. 1992
45.744
+0.774
1.72%
1 janv. 1993
47.07
+1.326
2.9%
1 janv. 1994
47.159
+0.089
0.19%
1 janv. 1995
46.99
-0.169
-0.36%
1 janv. 1996
47.766
+0.775
1.65%
1 janv. 1997
47.876
+0.111
0.23%
1 janv. 1998
48.933
+1.057
2.21%
1 janv. 1999
49.312
+0.379
0.77%
1 janv. 2000
48.63
-0.682
-1.38%
1 janv. 2001
48.111
-0.519
-1.07%
1 janv. 2002
48.461
+0.35
0.73%
1 janv. 2003
48.282
-0.179
-0.37%
1 janv. 2004
48.318
+0.037
0.08%
1 janv. 2005
48.284
-0.034
-0.07%
1 janv. 2006
49.04
+0.756
1.56%
1 janv. 2007
48.738
-0.302
-0.62%
1 janv. 2008
49.236
+0.498
1.02%
1 janv. 2009
49.624
+0.387
0.79%
1 janv. 2010
49.055
-0.569
-1.15%
1 janv. 2011
49.274
+0.219
0.45%
1 janv. 2012
48.733
-0.541
-1.1%
1 janv. 2013
47.544
-1.19
-2.44%
1 janv. 2014
47.088
-0.456
-0.96%
Classement des pays selon les statistiques actuelles par années


Commentaires: