29
/fr/
fr
AIzaSyAYiBZKx7MnpbEhh9jyipgxe19OcubqV5w
April 1, 2024
69002
Antigua and Barbuda
ATG
true
2
1
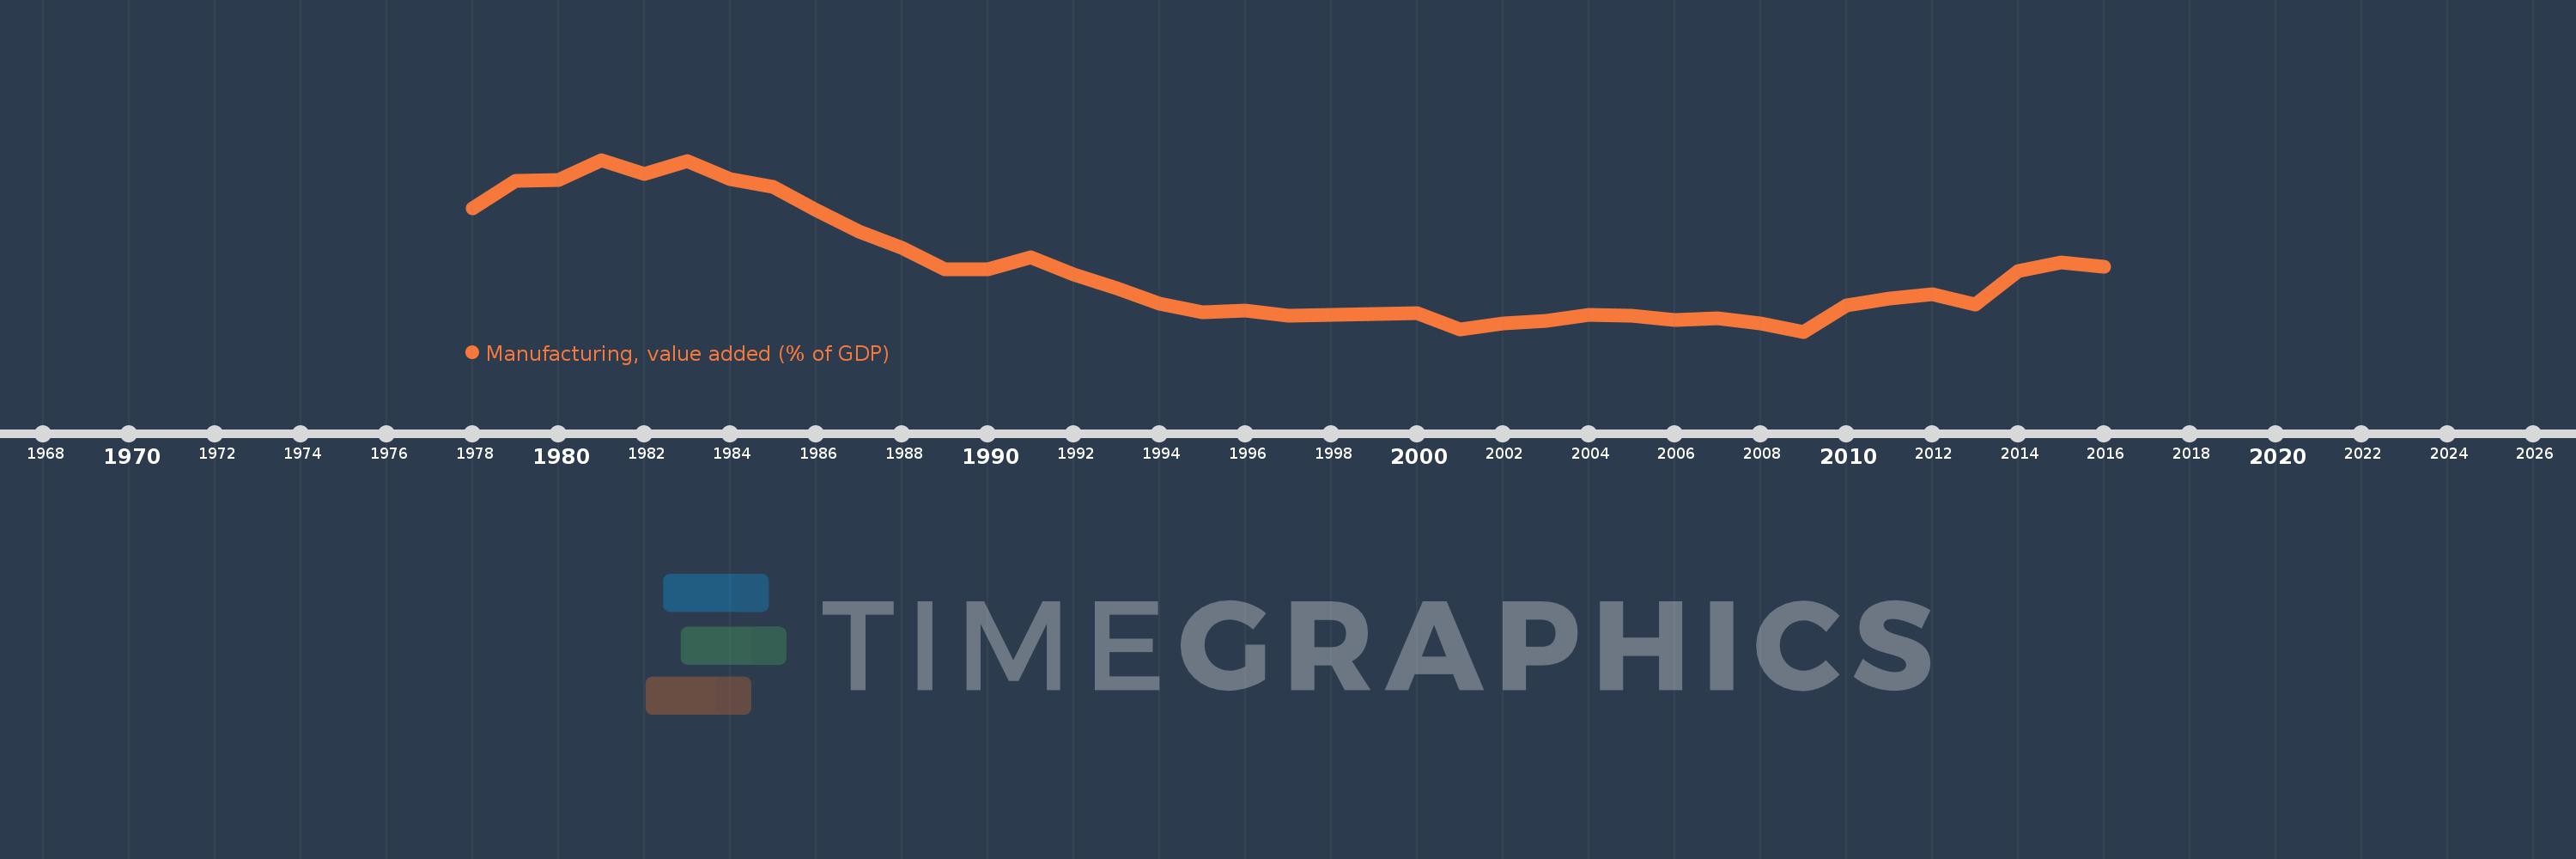
Manufacturing, value added (% of GDP)
2016,2015,2014,2013,2012,2011,2010,2009,2008,2007,2006,2005,2004,2003,2002,2001,2000,1999,1998,1997,1996,1995,1994,1993,1992,1991,1990,1989,1988,1987,1986,1985,1984,1983,1982,1981,1980,1979,1978
Cette statistique dans les autres pays:
AfghanistanAlbaniaAlgeriaAndorraAngolaAntigua and BarbudaArab WorldArgentinaArmeniaArubaAustraliaAustriaAzerbaijanBahamas, TheBahrainBangladeshBarbadosBelarusBelgiumBelizeBeninBermudaBhutanBoliviaBosnia and HerzegovinaBotswanaBrazilBrunei DarussalamBurkina FasoBurundiCabo VerdeCambodiaCameroonCanadaCaribbean small statesCayman IslandsCentral African RepublicCentral Europe and the BalticsChadChileChinaColombiaComorosCongo, Dem. Rep.Congo, Rep.Costa RicaCote d'IvoireCroatiaCubaCyprusCzech RepublicDenmarkDjiboutiDominicaDominican RepublicEarly-demographic dividendEast Asia & PacificEast Asia & Pacific (excluding high income)East Asia & Pacific (IDA & IBRD countries)EcuadorEgypt, Arab Rep.El SalvadorEquatorial GuineaEritreaEstoniaEthiopiaEuro areaEurope & Central AsiaEurope & Central Asia (excluding high income)Europe & Central Asia (IDA & IBRD countries)European UnionFaroe IslandsFijiFinlandFragile and conflict affected situationsFranceGabonGambia, TheGeorgiaGermanyGhanaGreeceGrenadaGuatemalaGuineaGuinea-BissauGuyanaHeavily indebted poor countries (HIPC)High incomeHondurasHong Kong SAR, ChinaHungaryIBRD onlyIcelandIDA & IBRD totalIDA blendIDA onlyIDA totalIndiaIndonesiaIran, Islamic Rep.IrelandItalyJamaicaJapanJordanKazakhstanKenyaKiribatiKorea, Rep.KosovoKuwaitKyrgyz RepublicLao PDRLate-demographic dividendLatin America & Caribbean Latin America & Caribbean (excluding high income)Latin America & the Caribbean (IDA & IBRD countries)LatviaLeast developed countries: UN classificationLebanonLesothoLibyaLithuaniaLow & middle incomeLow incomeLower middle incomeLuxembourgMacao SAR, ChinaMacedonia, FYRMadagascarMalawiMalaysiaMaldivesMaliMaltaMarshall IslandsMauritaniaMauritiusMexicoMicronesia, Fed. Sts.Middle East & North AfricaMiddle East & North Africa (excluding high income)Middle East & North Africa (IDA & IBRD countries)Middle incomeMoldovaMongoliaMontenegroMoroccoMozambiqueMyanmarNamibiaNepalNetherlandsNew CaledoniaNew ZealandNicaraguaNigerNigeriaNorth AmericaNorwayOECD membersOmanOther small statesPacific island small statesPakistanPalauPanamaPapua New GuineaParaguayPeruPhilippinesPolandPortugalPost-demographic dividendPre-demographic dividendPuerto RicoQatarRomaniaRussian FederationRwandaSao Tome and PrincipeSaudi ArabiaSenegalSerbiaSeychellesSierra LeoneSingaporeSlovak RepublicSloveniaSmall statesSolomon IslandsSomaliaSouth AfricaSouth AsiaSouth Asia (IDA & IBRD)SpainSri LankaSt. Kitts and NevisSt. LuciaSt. Vincent and the GrenadinesSub-Saharan Africa Sub-Saharan Africa (excluding high income)Sub-Saharan Africa (IDA & IBRD countries)SudanSurinameSwazilandSwedenSwitzerlandSyrian Arab RepublicTajikistanTanzaniaThailandTimor-LesteTogoTongaTrinidad and TobagoTunisiaTurkeyTurkmenistanTuvaluUgandaUkraineUnited KingdomUnited StatesUpper middle incomeUruguayUzbekistanVanuatuVenezuela, RBVietnamWest Bank and GazaWorldYemen, Rep.ZambiaZimbabwe La ligne de temps
Cette échelle de temps montre un graphique de 1978 année à 2016 année Antigua and Barbuda. Les données jusqu'à 1977 année ne sont pas présentés. Quantité d'observations actuelles selon dates: 39.
Source (désignation):
Les indicateurs du développement mondiale
Source (organisation):
World Bank national accounts data, and OECD National Accounts data files.
Catégories:
Economy & Growth
Dernière mise à jour
23 avr. 2017
Les indicateurs de changement de valeurs selon les années
Minimum:
1.885
1 janv. 2009
Maximum:
5.328
1 janv. 1981
Pour la date d''observation
Valeur
Changement absolu
Le changement par rapport à la valeur précédente
1 janv. 1978
4.348
+4.348
0.0%
1 janv. 1979
4.911
+0.563
12.96%
1 janv. 1980
4.921
+0.01
0.2%
1 janv. 1981
5.328
+0.407
8.27%
1 janv. 1982
5.045
-0.283
-5.3%
1 janv. 1983
5.297
+0.252
5.0%
1 janv. 1984
4.942
-0.355
-6.7%
1 janv. 1985
4.781
-0.161
-3.26%
1 janv. 1986
4.317
-0.465
-9.72%
1 janv. 1987
3.894
-0.423
-9.79%
1 janv. 1988
3.557
-0.337
-8.66%
1 janv. 1989
3.141
-0.416
-11.7%
1 janv. 1990
3.134
-0.006
-0.2%
1 janv. 1991
3.381
+0.246
7.86%
1 janv. 1992
3.028
-0.353
-10.44%
1 janv. 1993
2.757
-0.271
-8.96%
1 janv. 1994
2.438
-0.319
-11.55%
1 janv. 1995
2.274
-0.164
-6.75%
1 janv. 1996
2.305
+0.032
1.39%
1 janv. 1997
2.202
-0.104
-4.5%
1 janv. 1998
2.218
+0.016
0.72%
1 janv. 1999
2.242
+0.024
1.08%
1 janv. 2000
2.256
+0.015
0.65%
1 janv. 2001
1.927
-0.33
-14.6%
1 janv. 2002
2.042
+0.115
5.98%
1 janv. 2003
2.1
+0.058
2.84%
1 janv. 2004
2.215
+0.115
5.48%
1 janv. 2005
2.21
-0.005
-0.22%
1 janv. 2006
2.115
-0.095
-4.29%
1 janv. 2007
2.147
+0.031
1.48%
1 janv. 2008
2.043
-0.103
-4.82%
1 janv. 2009
1.885
-0.158
-7.75%
1 janv. 2010
2.412
+0.527
27.95%
1 janv. 2011
2.545
+0.133
5.51%
1 janv. 2012
2.641
+0.096
3.76%
1 janv. 2013
2.425
-0.215
-8.15%
1 janv. 2014
3.101
+0.675
27.85%
1 janv. 2015
3.263
+0.162
5.23%
1 janv. 2016
3.187
-0.076
-2.33%
Classement des pays selon les statistiques actuelles par années


Commentaires: