29
/fr/
fr
AIzaSyAYiBZKx7MnpbEhh9jyipgxe19OcubqV5w
April 1, 2024
29259
East Asia & Pacific (IDA & IBRD countries)
TEA
false
2
1
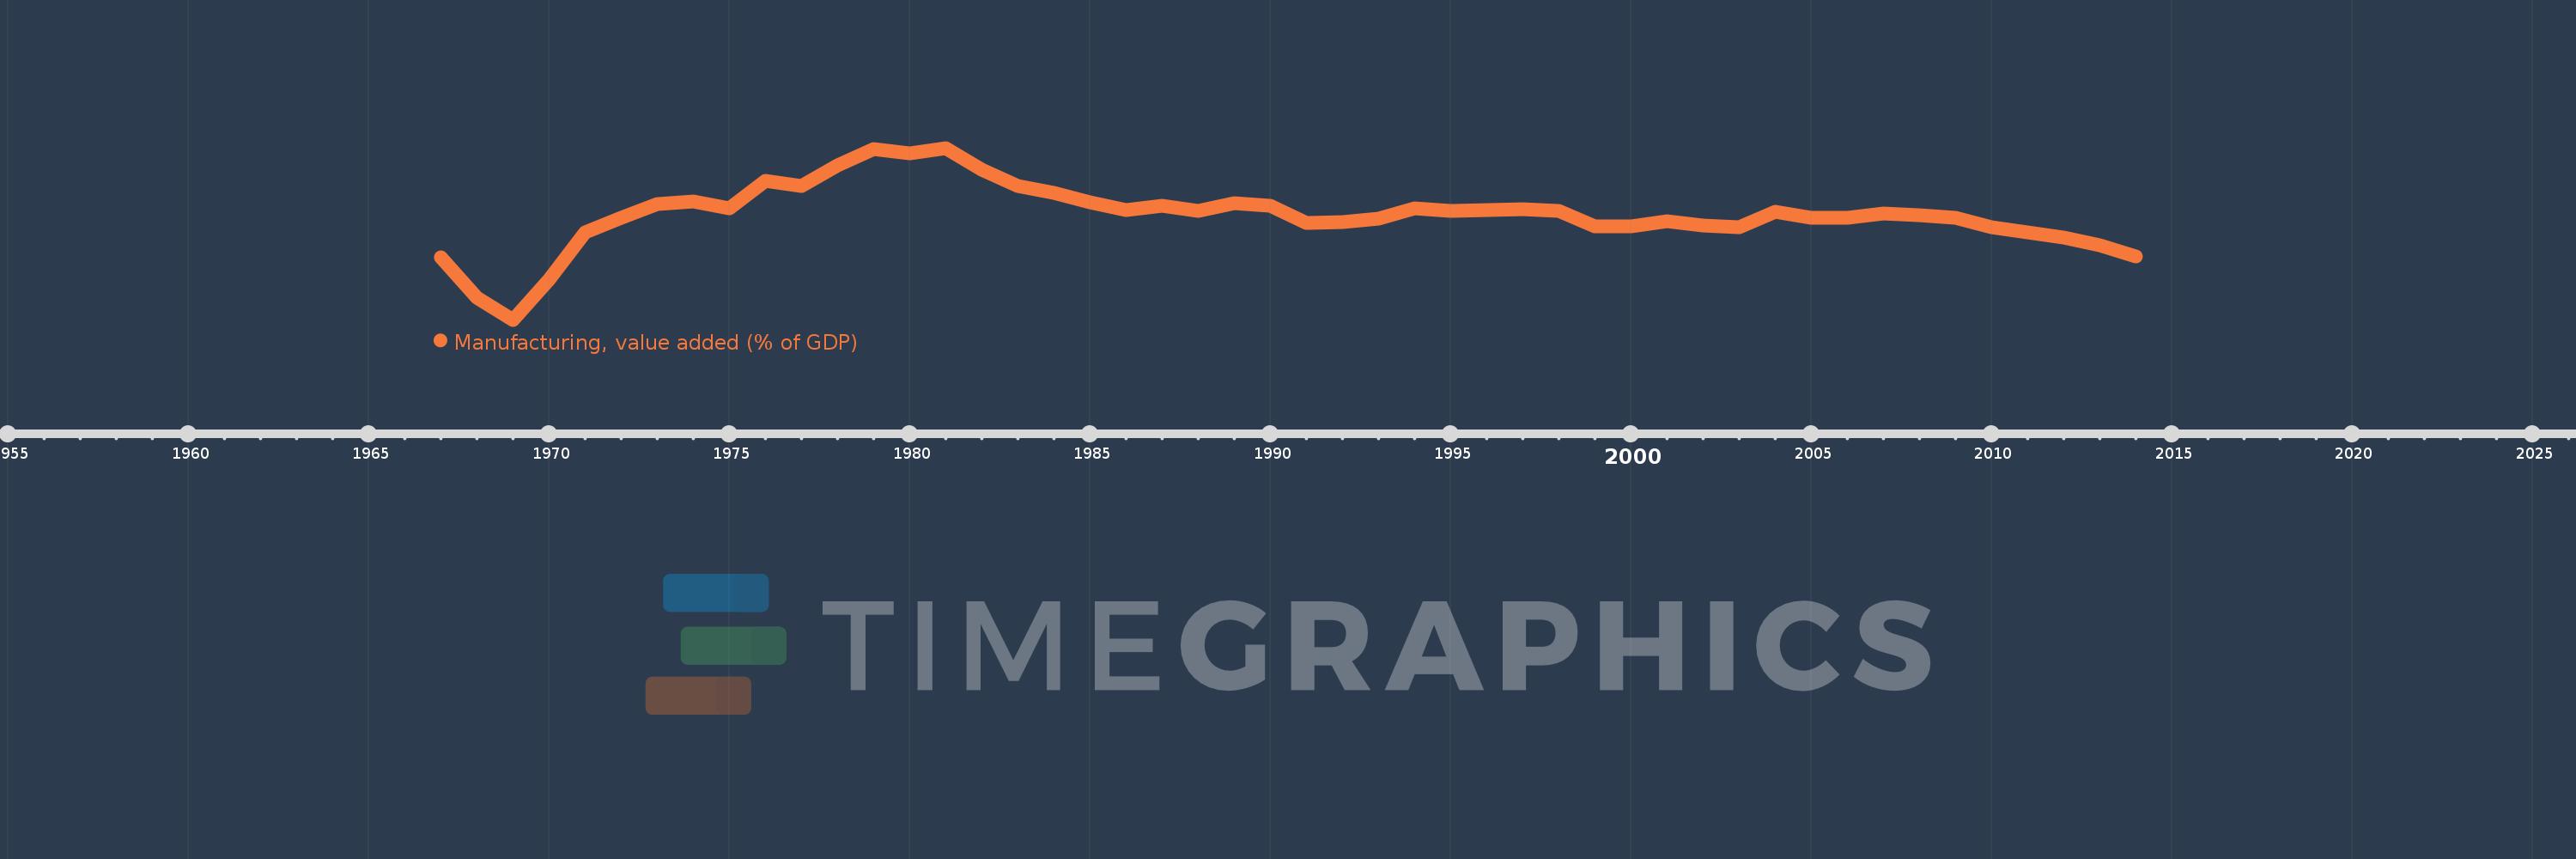
Manufacturing, value added (% of GDP)
2014,2013,2012,2011,2010,2009,2008,2007,2006,2005,2004,2003,2002,2001,2000,1999,1998,1997,1996,1995,1994,1993,1992,1991,1990,1989,1988,1987,1986,1985,1984,1983,1982,1981,1980,1979,1978,1977,1976,1975,1974,1973,1972,1971,1970,1969,1968,1967
Cette statistique dans les autres pays:
AfghanistanAlbaniaAlgeriaAndorraAngolaAntigua and BarbudaArab WorldArgentinaArmeniaArubaAustraliaAustriaAzerbaijanBahamas, TheBahrainBangladeshBarbadosBelarusBelgiumBelizeBeninBermudaBhutanBoliviaBosnia and HerzegovinaBotswanaBrazilBrunei DarussalamBurkina FasoBurundiCabo VerdeCambodiaCameroonCanadaCaribbean small statesCayman IslandsCentral African RepublicCentral Europe and the BalticsChadChileChinaColombiaComorosCongo, Dem. Rep.Congo, Rep.Costa RicaCote d'IvoireCroatiaCubaCyprusCzech RepublicDenmarkDjiboutiDominicaDominican RepublicEarly-demographic dividendEast Asia & PacificEast Asia & Pacific (excluding high income)East Asia & Pacific (IDA & IBRD countries)EcuadorEgypt, Arab Rep.El SalvadorEquatorial GuineaEritreaEstoniaEthiopiaEuro areaEurope & Central AsiaEurope & Central Asia (excluding high income)Europe & Central Asia (IDA & IBRD countries)European UnionFaroe IslandsFijiFinlandFragile and conflict affected situationsFranceGabonGambia, TheGeorgiaGermanyGhanaGreeceGrenadaGuatemalaGuineaGuinea-BissauGuyanaHeavily indebted poor countries (HIPC)High incomeHondurasHong Kong SAR, ChinaHungaryIBRD onlyIcelandIDA & IBRD totalIDA blendIDA onlyIDA totalIndiaIndonesiaIran, Islamic Rep.IrelandItalyJamaicaJapanJordanKazakhstanKenyaKiribatiKorea, Rep.KosovoKuwaitKyrgyz RepublicLao PDRLate-demographic dividendLatin America & Caribbean Latin America & Caribbean (excluding high income)Latin America & the Caribbean (IDA & IBRD countries)LatviaLeast developed countries: UN classificationLebanonLesothoLibyaLithuaniaLow & middle incomeLow incomeLower middle incomeLuxembourgMacao SAR, ChinaMacedonia, FYRMadagascarMalawiMalaysiaMaldivesMaliMaltaMarshall IslandsMauritaniaMauritiusMexicoMicronesia, Fed. Sts.Middle East & North AfricaMiddle East & North Africa (excluding high income)Middle East & North Africa (IDA & IBRD countries)Middle incomeMoldovaMongoliaMontenegroMoroccoMozambiqueMyanmarNamibiaNepalNetherlandsNew CaledoniaNew ZealandNicaraguaNigerNigeriaNorth AmericaNorwayOECD membersOmanOther small statesPacific island small statesPakistanPalauPanamaPapua New GuineaParaguayPeruPhilippinesPolandPortugalPost-demographic dividendPre-demographic dividendPuerto RicoQatarRomaniaRussian FederationRwandaSao Tome and PrincipeSaudi ArabiaSenegalSerbiaSeychellesSierra LeoneSingaporeSlovak RepublicSloveniaSmall statesSolomon IslandsSomaliaSouth AfricaSouth AsiaSouth Asia (IDA & IBRD)SpainSri LankaSt. Kitts and NevisSt. LuciaSt. Vincent and the GrenadinesSub-Saharan Africa Sub-Saharan Africa (excluding high income)Sub-Saharan Africa (IDA & IBRD countries)SudanSurinameSwazilandSwedenSwitzerlandSyrian Arab RepublicTajikistanTanzaniaThailandTimor-LesteTogoTongaTrinidad and TobagoTunisiaTurkeyTurkmenistanTuvaluUgandaUkraineUnited KingdomUnited StatesUpper middle incomeUruguayUzbekistanVanuatuVenezuela, RBVietnamWest Bank and GazaWorldYemen, Rep.ZambiaZimbabwe La ligne de temps
Cette échelle de temps montre un graphique de 1967 année à 2014 année East Asia & Pacific (IDA & IBRD countries). Les données jusqu'à 1966 année ne sont pas présentés. Quantité d'observations actuelles selon dates: 48.
Source (désignation):
Les indicateurs du développement mondiale
Source (organisation):
World Bank national accounts data, and OECD National Accounts data files.
Catégories:
Economy & Growth
Dernière mise à jour
23 avr. 2017
Les indicateurs de changement de valeurs selon les années
Minimum:
23.463
1 janv. 1969
Maximum:
35.729
1 janv. 1981
Pour la date d''observation
Valeur
Changement absolu
Le changement par rapport à la valeur précédente
1 janv. 1967
27.933
+27.933
0.0%
1 janv. 1968
25.022
-2.911
-10.42%
1 janv. 1969
23.463
-1.559
-6.23%
1 janv. 1970
26.356
+2.893
12.33%
1 janv. 1971
29.703
+3.348
12.7%
1 janv. 1972
30.743
+1.04
3.5%
1 janv. 1973
31.751
+1.008
3.28%
1 janv. 1974
31.931
+0.179
0.56%
1 janv. 1975
31.399
-0.531
-1.66%
1 janv. 1976
33.376
+1.977
6.3%
1 janv. 1977
33.014
-0.362
-1.09%
1 janv. 1978
34.489
+1.475
4.47%
1 janv. 1979
35.676
+1.187
3.44%
1 janv. 1980
35.323
-0.354
-0.99%
1 janv. 1981
35.729
+0.406
1.15%
1 janv. 1982
34.157
-1.573
-4.4%
1 janv. 1983
33.021
-1.136
-3.32%
1 janv. 1984
32.496
-0.525
-1.59%
1 janv. 1985
31.827
-0.67
-2.06%
1 janv. 1986
31.322
-0.504
-1.58%
1 janv. 1987
31.622
+0.3
0.96%
1 janv. 1988
31.262
-0.361
-1.14%
1 janv. 1989
31.802
+0.541
1.73%
1 janv. 1990
31.573
-0.229
-0.72%
1 janv. 1991
30.356
-1.217
-3.85%
1 janv. 1992
30.457
+0.101
0.33%
1 janv. 1993
30.663
+0.206
0.68%
1 janv. 1994
31.409
+0.746
2.43%
1 janv. 1995
31.234
-0.175
-0.56%
1 janv. 1996
31.321
+0.087
0.28%
1 janv. 1997
31.352
+0.031
0.1%
1 janv. 1998
31.237
-0.115
-0.37%
1 janv. 1999
30.134
-1.103
-3.53%
1 janv. 2000
30.131
-0.003
-0.01%
1 janv. 2001
30.513
+0.382
1.27%
1 janv. 2002
30.201
-0.312
-1.02%
1 janv. 2003
30.038
-0.163
-0.54%
1 janv. 2004
31.168
+1.129
3.76%
1 janv. 2005
30.763
-0.404
-1.3%
1 janv. 2006
30.761
-0.002
-0.01%
1 janv. 2007
31.076
+0.315
1.02%
1 janv. 2008
30.917
-0.16
-0.51%
1 janv. 2009
30.716
-0.201
-0.65%
1 janv. 2010
30.046
-0.67
-2.18%
1 janv. 2011
29.674
-0.372
-1.24%
1 janv. 2012
29.356
-0.318
-1.07%
1 janv. 2013
28.775
-0.58
-1.98%
1 janv. 2014
27.99
-0.785
-2.73%
Classement des pays selon les statistiques actuelles par années


Commentaires: