29
/fr/
fr
AIzaSyAYiBZKx7MnpbEhh9jyipgxe19OcubqV5w
April 1, 2024
57266
South Asia
SAS
false
2
1
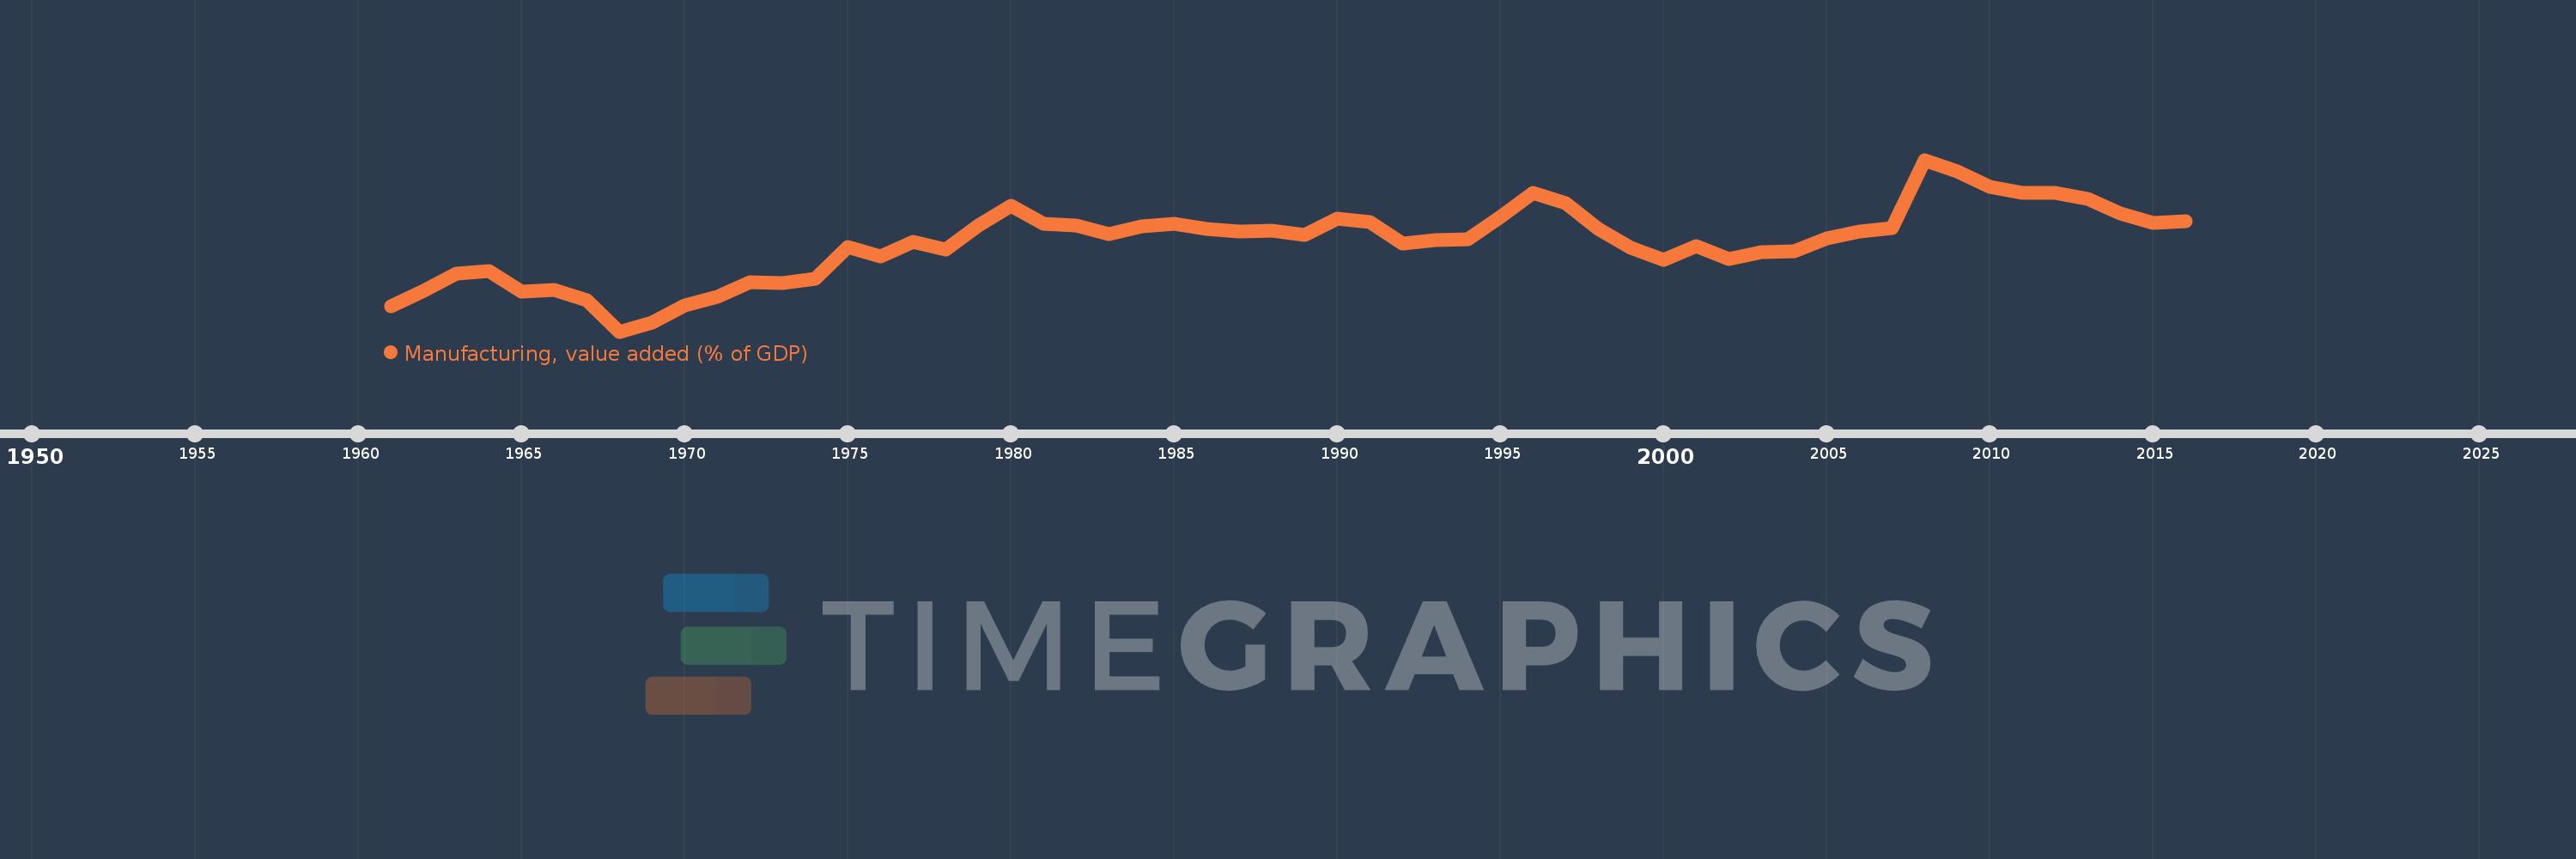
Manufacturing, value added (% of GDP)
2016,2015,2014,2013,2012,2011,2010,2009,2008,2007,2006,2005,2004,2003,2002,2001,2000,1999,1998,1997,1996,1995,1994,1993,1992,1991,1990,1989,1988,1987,1986,1985,1984,1983,1982,1981,1980,1979,1978,1977,1976,1975,1974,1973,1972,1971,1970,1969,1968,1967,1966,1965,1964,1963,1962,1961
Cette statistique dans les autres pays:
AfghanistanAlbaniaAlgeriaAndorraAngolaAntigua and BarbudaArab WorldArgentinaArmeniaArubaAustraliaAustriaAzerbaijanBahamas, TheBahrainBangladeshBarbadosBelarusBelgiumBelizeBeninBermudaBhutanBoliviaBosnia and HerzegovinaBotswanaBrazilBrunei DarussalamBurkina FasoBurundiCabo VerdeCambodiaCameroonCanadaCaribbean small statesCayman IslandsCentral African RepublicCentral Europe and the BalticsChadChileChinaColombiaComorosCongo, Dem. Rep.Congo, Rep.Costa RicaCote d'IvoireCroatiaCubaCyprusCzech RepublicDenmarkDjiboutiDominicaDominican RepublicEarly-demographic dividendEast Asia & PacificEast Asia & Pacific (excluding high income)East Asia & Pacific (IDA & IBRD countries)EcuadorEgypt, Arab Rep.El SalvadorEquatorial GuineaEritreaEstoniaEthiopiaEuro areaEurope & Central AsiaEurope & Central Asia (excluding high income)Europe & Central Asia (IDA & IBRD countries)European UnionFaroe IslandsFijiFinlandFragile and conflict affected situationsFranceGabonGambia, TheGeorgiaGermanyGhanaGreeceGrenadaGuatemalaGuineaGuinea-BissauGuyanaHeavily indebted poor countries (HIPC)High incomeHondurasHong Kong SAR, ChinaHungaryIBRD onlyIcelandIDA & IBRD totalIDA blendIDA onlyIDA totalIndiaIndonesiaIran, Islamic Rep.IrelandItalyJamaicaJapanJordanKazakhstanKenyaKiribatiKorea, Rep.KosovoKuwaitKyrgyz RepublicLao PDRLate-demographic dividendLatin America & Caribbean Latin America & Caribbean (excluding high income)Latin America & the Caribbean (IDA & IBRD countries)LatviaLeast developed countries: UN classificationLebanonLesothoLibyaLithuaniaLow & middle incomeLow incomeLower middle incomeLuxembourgMacao SAR, ChinaMacedonia, FYRMadagascarMalawiMalaysiaMaldivesMaliMaltaMarshall IslandsMauritaniaMauritiusMexicoMicronesia, Fed. Sts.Middle East & North AfricaMiddle East & North Africa (excluding high income)Middle East & North Africa (IDA & IBRD countries)Middle incomeMoldovaMongoliaMontenegroMoroccoMozambiqueMyanmarNamibiaNepalNetherlandsNew CaledoniaNew ZealandNicaraguaNigerNigeriaNorth AmericaNorwayOECD membersOmanOther small statesPacific island small statesPakistanPalauPanamaPapua New GuineaParaguayPeruPhilippinesPolandPortugalPost-demographic dividendPre-demographic dividendPuerto RicoQatarRomaniaRussian FederationRwandaSao Tome and PrincipeSaudi ArabiaSenegalSerbiaSeychellesSierra LeoneSingaporeSlovak RepublicSloveniaSmall statesSolomon IslandsSomaliaSouth AfricaSouth AsiaSouth Asia (IDA & IBRD)SpainSri LankaSt. Kitts and NevisSt. LuciaSt. Vincent and the GrenadinesSub-Saharan Africa Sub-Saharan Africa (excluding high income)Sub-Saharan Africa (IDA & IBRD countries)SudanSurinameSwazilandSwedenSwitzerlandSyrian Arab RepublicTajikistanTanzaniaThailandTimor-LesteTogoTongaTrinidad and TobagoTunisiaTurkeyTurkmenistanTuvaluUgandaUkraineUnited KingdomUnited StatesUpper middle incomeUruguayUzbekistanVanuatuVenezuela, RBVietnamWest Bank and GazaWorldYemen, Rep.ZambiaZimbabwe La ligne de temps
Cette échelle de temps montre un graphique de 1961 année à 2016 année South Asia. Les données jusqu'à 1960 année ne sont pas présentés. Quantité d'observations actuelles selon dates: 56.
Source (désignation):
Les indicateurs du développement mondiale
Source (organisation):
World Bank national accounts data, and OECD National Accounts data files.
Catégories:
Economy & Growth
Dernière mise à jour
23 avr. 2017
Les indicateurs de changement de valeurs selon les années
Minimum:
12.138
1 janv. 1968
Maximum:
18.16
1 janv. 2008
Pour la date d''observation
Valeur
Changement absolu
Le changement par rapport à la valeur précédente
1 janv. 1961
13.015
+13.015
0.0%
1 janv. 1962
13.576
+0.561
4.31%
1 janv. 1963
14.163
+0.588
4.33%
1 janv. 1964
14.246
+0.083
0.58%
1 janv. 1965
13.534
-0.712
-5.0%
1 janv. 1966
13.611
+0.077
0.57%
1 janv. 1967
13.238
-0.373
-2.74%
1 janv. 1968
12.138
-1.1
-8.31%
1 janv. 1969
12.466
+0.328
2.7%
1 janv. 1970
13.071
+0.605
4.86%
1 janv. 1971
13.36
+0.289
2.21%
1 janv. 1972
13.877
+0.517
3.87%
1 janv. 1973
13.829
-0.048
-0.34%
1 janv. 1974
13.979
+0.15
1.08%
1 janv. 1975
15.103
+1.125
8.05%
1 janv. 1976
14.781
-0.323
-2.14%
1 janv. 1977
15.276
+0.495
3.35%
1 janv. 1978
15.01
-0.266
-1.74%
1 janv. 1979
15.842
+0.832
5.54%
1 janv. 1980
16.555
+0.713
4.5%
1 janv. 1981
15.904
-0.65
-3.93%
1 janv. 1982
15.856
-0.049
-0.31%
1 janv. 1983
15.552
-0.303
-1.91%
1 janv. 1984
15.812
+0.26
1.67%
1 janv. 1985
15.931
+0.118
0.75%
1 janv. 1986
15.743
-0.188
-1.18%
1 janv. 1987
15.656
-0.086
-0.55%
1 janv. 1988
15.673
+0.017
0.11%
1 janv. 1989
15.519
-0.154
-0.98%
1 janv. 1990
16.084
+0.564
3.64%
1 janv. 1991
15.975
-0.109
-0.68%
1 janv. 1992
15.212
-0.762
-4.77%
1 janv. 1993
15.359
+0.147
0.97%
1 janv. 1994
15.37
+0.011
0.07%
1 janv. 1995
16.146
+0.776
5.05%
1 janv. 1996
17.008
+0.862
5.34%
1 janv. 1997
16.645
-0.363
-2.13%
1 janv. 1998
15.725
-0.92
-5.53%
1 janv. 1999
15.072
-0.653
-4.15%
1 janv. 2000
14.665
-0.406
-2.7%
1 janv. 2001
15.149
+0.484
3.3%
1 janv. 2002
14.688
-0.461
-3.04%
1 janv. 2003
14.912
+0.224
1.52%
1 janv. 2004
14.959
+0.047
0.32%
1 janv. 2005
15.39
+0.431
2.88%
1 janv. 2006
15.648
+0.257
1.67%
1 janv. 2007
15.768
+0.121
0.77%
1 janv. 2008
18.16
+2.392
15.17%
1 janv. 2009
17.74
-0.42
-2.31%
1 janv. 2010
17.217
-0.522
-2.94%
1 janv. 2011
17.001
-0.216
-1.26%
1 janv. 2012
17.011
+0.009
0.06%
1 janv. 2013
16.792
-0.218
-1.28%
1 janv. 2014
16.281
-0.511
-3.04%
1 janv. 2015
15.941
-0.34
-2.09%
1 janv. 2016
16.016
+0.074
0.47%
Classement des pays selon les statistiques actuelles par années


Commentaires: