29
/fr/
fr
AIzaSyAYiBZKx7MnpbEhh9jyipgxe19OcubqV5w
April 1, 2024
252107
St. Vincent and the Grenadines
VCT
true
2
1
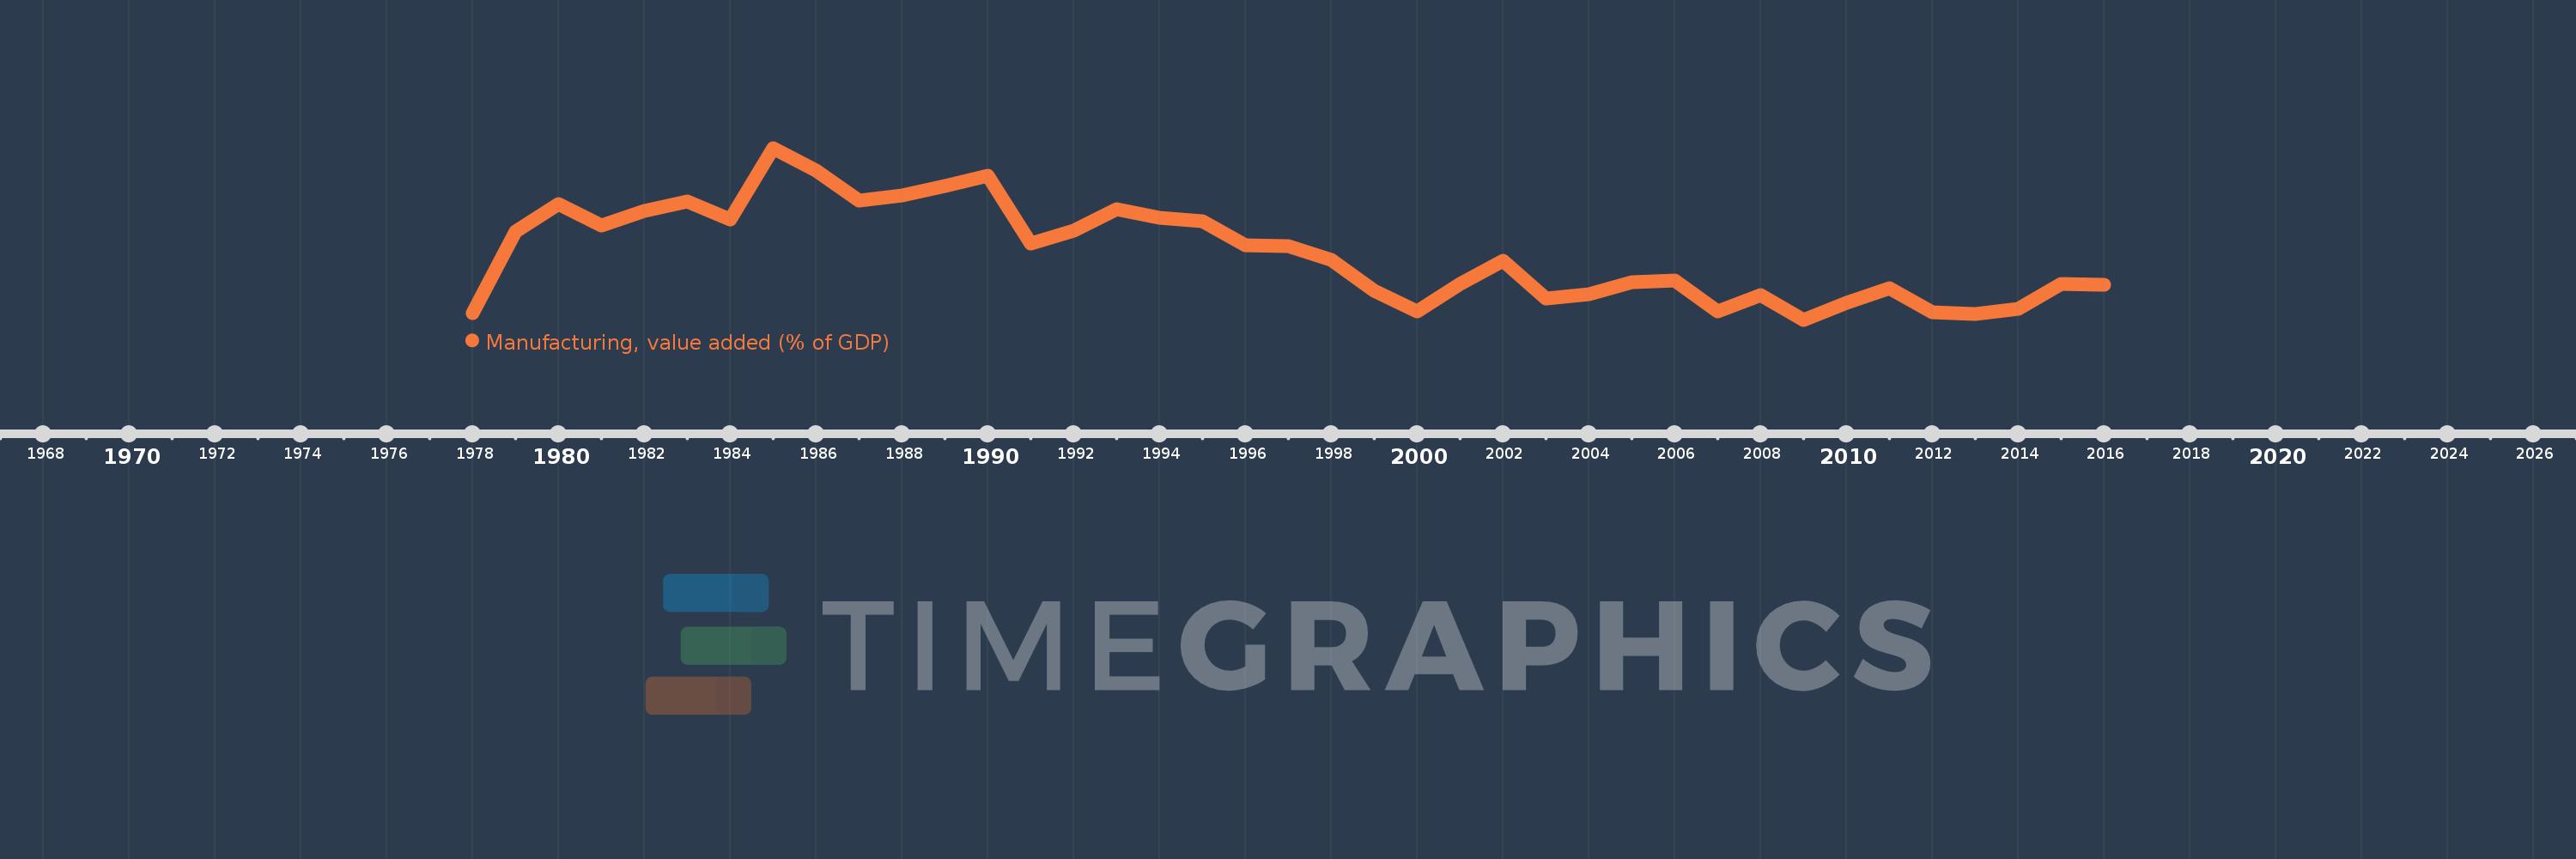
Manufacturing, value added (% of GDP)
2016,2015,2014,2013,2012,2011,2010,2009,2008,2007,2006,2005,2004,2003,2002,2001,2000,1999,1998,1997,1996,1995,1994,1993,1992,1991,1990,1989,1988,1987,1986,1985,1984,1983,1982,1981,1980,1979,1978
Cette statistique dans les autres pays:
AfghanistanAlbaniaAlgeriaAndorraAngolaAntigua and BarbudaArab WorldArgentinaArmeniaArubaAustraliaAustriaAzerbaijanBahamas, TheBahrainBangladeshBarbadosBelarusBelgiumBelizeBeninBermudaBhutanBoliviaBosnia and HerzegovinaBotswanaBrazilBrunei DarussalamBurkina FasoBurundiCabo VerdeCambodiaCameroonCanadaCaribbean small statesCayman IslandsCentral African RepublicCentral Europe and the BalticsChadChileChinaColombiaComorosCongo, Dem. Rep.Congo, Rep.Costa RicaCote d'IvoireCroatiaCubaCyprusCzech RepublicDenmarkDjiboutiDominicaDominican RepublicEarly-demographic dividendEast Asia & PacificEast Asia & Pacific (excluding high income)East Asia & Pacific (IDA & IBRD countries)EcuadorEgypt, Arab Rep.El SalvadorEquatorial GuineaEritreaEstoniaEthiopiaEuro areaEurope & Central AsiaEurope & Central Asia (excluding high income)Europe & Central Asia (IDA & IBRD countries)European UnionFaroe IslandsFijiFinlandFragile and conflict affected situationsFranceGabonGambia, TheGeorgiaGermanyGhanaGreeceGrenadaGuatemalaGuineaGuinea-BissauGuyanaHeavily indebted poor countries (HIPC)High incomeHondurasHong Kong SAR, ChinaHungaryIBRD onlyIcelandIDA & IBRD totalIDA blendIDA onlyIDA totalIndiaIndonesiaIran, Islamic Rep.IrelandItalyJamaicaJapanJordanKazakhstanKenyaKiribatiKorea, Rep.KosovoKuwaitKyrgyz RepublicLao PDRLate-demographic dividendLatin America & Caribbean Latin America & Caribbean (excluding high income)Latin America & the Caribbean (IDA & IBRD countries)LatviaLeast developed countries: UN classificationLebanonLesothoLibyaLithuaniaLow & middle incomeLow incomeLower middle incomeLuxembourgMacao SAR, ChinaMacedonia, FYRMadagascarMalawiMalaysiaMaldivesMaliMaltaMarshall IslandsMauritaniaMauritiusMexicoMicronesia, Fed. Sts.Middle East & North AfricaMiddle East & North Africa (excluding high income)Middle East & North Africa (IDA & IBRD countries)Middle incomeMoldovaMongoliaMontenegroMoroccoMozambiqueMyanmarNamibiaNepalNetherlandsNew CaledoniaNew ZealandNicaraguaNigerNigeriaNorth AmericaNorwayOECD membersOmanOther small statesPacific island small statesPakistanPalauPanamaPapua New GuineaParaguayPeruPhilippinesPolandPortugalPost-demographic dividendPre-demographic dividendPuerto RicoQatarRomaniaRussian FederationRwandaSao Tome and PrincipeSaudi ArabiaSenegalSerbiaSeychellesSierra LeoneSingaporeSlovak RepublicSloveniaSmall statesSolomon IslandsSomaliaSouth AfricaSouth AsiaSouth Asia (IDA & IBRD)SpainSri LankaSt. Kitts and NevisSt. LuciaSt. Vincent and the GrenadinesSub-Saharan Africa Sub-Saharan Africa (excluding high income)Sub-Saharan Africa (IDA & IBRD countries)SudanSurinameSwazilandSwedenSwitzerlandSyrian Arab RepublicTajikistanTanzaniaThailandTimor-LesteTogoTongaTrinidad and TobagoTunisiaTurkeyTurkmenistanTuvaluUgandaUkraineUnited KingdomUnited StatesUpper middle incomeUruguayUzbekistanVanuatuVenezuela, RBVietnamWest Bank and GazaWorldYemen, Rep.ZambiaZimbabwe La ligne de temps
Cette échelle de temps montre un graphique de 1978 année à 2016 année St. Vincent and the Grenadines. Les données jusqu'à 1977 année ne sont pas présentés. Quantité d'observations actuelles selon dates: 39.
Source (désignation):
Les indicateurs du développement mondiale
Source (organisation):
World Bank national accounts data, and OECD National Accounts data files.
Catégories:
Economy & Growth
Dernière mise à jour
23 avr. 2017
Les indicateurs de changement de valeurs selon les années
Maximum:
9.346
1 janv. 1985
Pour la date d''observation
Valeur
Changement absolu
Le changement par rapport à la valeur précédente
1 janv. 1978
5.061
+5.061
0.0%
1 janv. 1979
7.176
+2.115
41.79%
1 janv. 1980
7.881
+0.705
9.82%
1 janv. 1981
7.33
-0.551
-6.99%
1 janv. 1982
7.72
+0.39
5.32%
1 janv. 1983
7.956
+0.237
3.07%
1 janv. 1984
7.501
-0.455
-5.72%
1 janv. 1985
9.346
+1.844
24.59%
1 janv. 1986
8.763
-0.583
-6.23%
1 janv. 1987
7.976
-0.787
-8.98%
1 janv. 1988
8.11
+0.134
1.68%
1 janv. 1989
8.354
+0.244
3.0%
1 janv. 1990
8.631
+0.277
3.31%
1 janv. 1991
6.862
-1.768
-20.49%
1 janv. 1992
7.209
+0.347
5.05%
1 janv. 1993
7.767
+0.558
7.74%
1 janv. 1994
7.534
-0.233
-3.0%
1 janv. 1995
7.446
-0.088
-1.16%
1 janv. 1996
6.831
-0.616
-8.27%
1 janv. 1997
6.804
-0.027
-0.39%
1 janv. 1998
6.446
-0.358
-5.26%
1 janv. 1999
5.638
-0.808
-12.53%
1 janv. 2000
5.117
-0.522
-9.25%
1 janv. 2001
5.817
+0.701
13.7%
1 janv. 2002
6.428
+0.61
10.49%
1 janv. 2003
5.436
-0.992
-15.43%
1 janv. 2004
5.545
+0.109
2.01%
1 janv. 2005
5.864
+0.318
5.74%
1 janv. 2006
5.919
+0.055
0.94%
1 janv. 2007
5.108
-0.811
-13.69%
1 janv. 2008
5.537
+0.429
8.39%
1 janv. 2009
4.89
-0.647
-11.68%
1 janv. 2010
5.325
+0.435
8.9%
1 janv. 2011
5.699
+0.373
7.01%
1 janv. 2012
5.087
-0.612
-10.73%
1 janv. 2013
5.037
-0.05
-0.99%
1 janv. 2014
5.167
+0.13
2.58%
1 janv. 2015
5.816
+0.65
12.57%
1 janv. 2016
5.802
-0.014
-0.24%
Classement des pays selon les statistiques actuelles par années


Commentaires: