30
/fr/
AIzaSyAYiBZKx7MnpbEhh9jyipgxe19OcubqV5w
April 1, 2024
65114
Albania
ALB
true
2
1
Net ODA received (% of GNI)
2015,2014,2013,2012,2011,2010,2009,2008,2007,2006,2005,2004,2003,2002,2001,2000,1999,1998,1997,1996,1995,1994,1993,1992,1991,1990,1989
Download
Bibliothèque de statistiques globales →Albania →

Net ODA received (% of GNI)

Cette statistique dans les autres pays:

AfghanistanAlbaniaAlgeriaAngolaAntigua and BarbudaArab WorldArgentinaArmeniaAzerbaijanBahamas, TheBahrainBangladeshBarbadosBelarusBelizeBeninBermudaBhutanBoliviaBosnia and HerzegovinaBotswanaBrazilBrunei DarussalamBurkina FasoBurundiCabo VerdeCambodiaCameroonCaribbean small statesCentral African RepublicCentral Europe and the BalticsChadChileChinaColombiaComorosCongo, Dem. Rep.Congo, Rep.Costa RicaCote d'IvoireCroatiaCubaCyprusDjiboutiDominicaDominican RepublicEast Asia & PacificEast Asia & Pacific (excluding high income)East Asia & Pacific (IDA & IBRD countries)EcuadorEgypt, Arab Rep.El SalvadorEquatorial GuineaEritreaEthiopiaEuro areaEurope & Central AsiaEurope & Central Asia (excluding high income)Europe & Central Asia (IDA & IBRD countries)European UnionFijiFragile and conflict affected situationsFrench PolynesiaGabonGambia, TheGeorgiaGhanaGrenadaGuatemalaGuineaGuinea-BissauGuyanaHaitiHeavily indebted poor countries (HIPC)High incomeHondurasHong Kong SAR, ChinaIBRD onlyIDA & IBRD totalIDA blendIDA onlyIDA totalIndiaIndonesiaIran, Islamic Rep.IraqIsraelJamaicaJordanKazakhstanKenyaKiribatiKorea, Rep.KosovoKuwaitKyrgyz RepublicLao PDRLatin America & Caribbean Latin America & Caribbean (excluding high income)Latin America & the Caribbean (IDA & IBRD countries)Least developed countries: UN classificationLebanonLesothoLiberiaLibyaLow & middle incomeLow incomeLower middle incomeMacao SAR, ChinaMacedonia, FYRMadagascarMalawiMalaysiaMaldivesMaliMaltaMarshall IslandsMauritaniaMauritiusMexicoMicronesia, Fed. Sts.Middle East & North AfricaMiddle East & North Africa (excluding high income)Middle East & North Africa (IDA & IBRD countries)Middle incomeMoldovaMongoliaMontenegroMoroccoMozambiqueMyanmarNamibiaNauruNepalNew CaledoniaNicaraguaNigerNigeriaNorth AmericaOECD membersOmanOther small statesPacific island small statesPakistanPalauPanamaPapua New GuineaParaguayPeruPhilippinesQatarRwandaSamoaSao Tome and PrincipeSaudi ArabiaSenegalSerbiaSeychellesSierra LeoneSingaporeSloveniaSmall statesSolomon IslandsSomaliaSouth AfricaSouth AsiaSouth Asia (IDA & IBRD)South SudanSri LankaSt. Kitts and NevisSt. LuciaSt. Vincent and the GrenadinesSub-Saharan Africa Sub-Saharan Africa (excluding high income)Sub-Saharan Africa (IDA & IBRD countries)SudanSurinameSwazilandSyrian Arab RepublicTajikistanTanzaniaThailandTimor-LesteTogoTongaTrinidad and TobagoTunisiaTurkeyTurkmenistanTuvaluUgandaUkraineUpper middle incomeUruguayUzbekistanVanuatuVenezuela, RBVietnamWest Bank and GazaWorldYemen, Rep.ZambiaZimbabwe

La ligne de temps

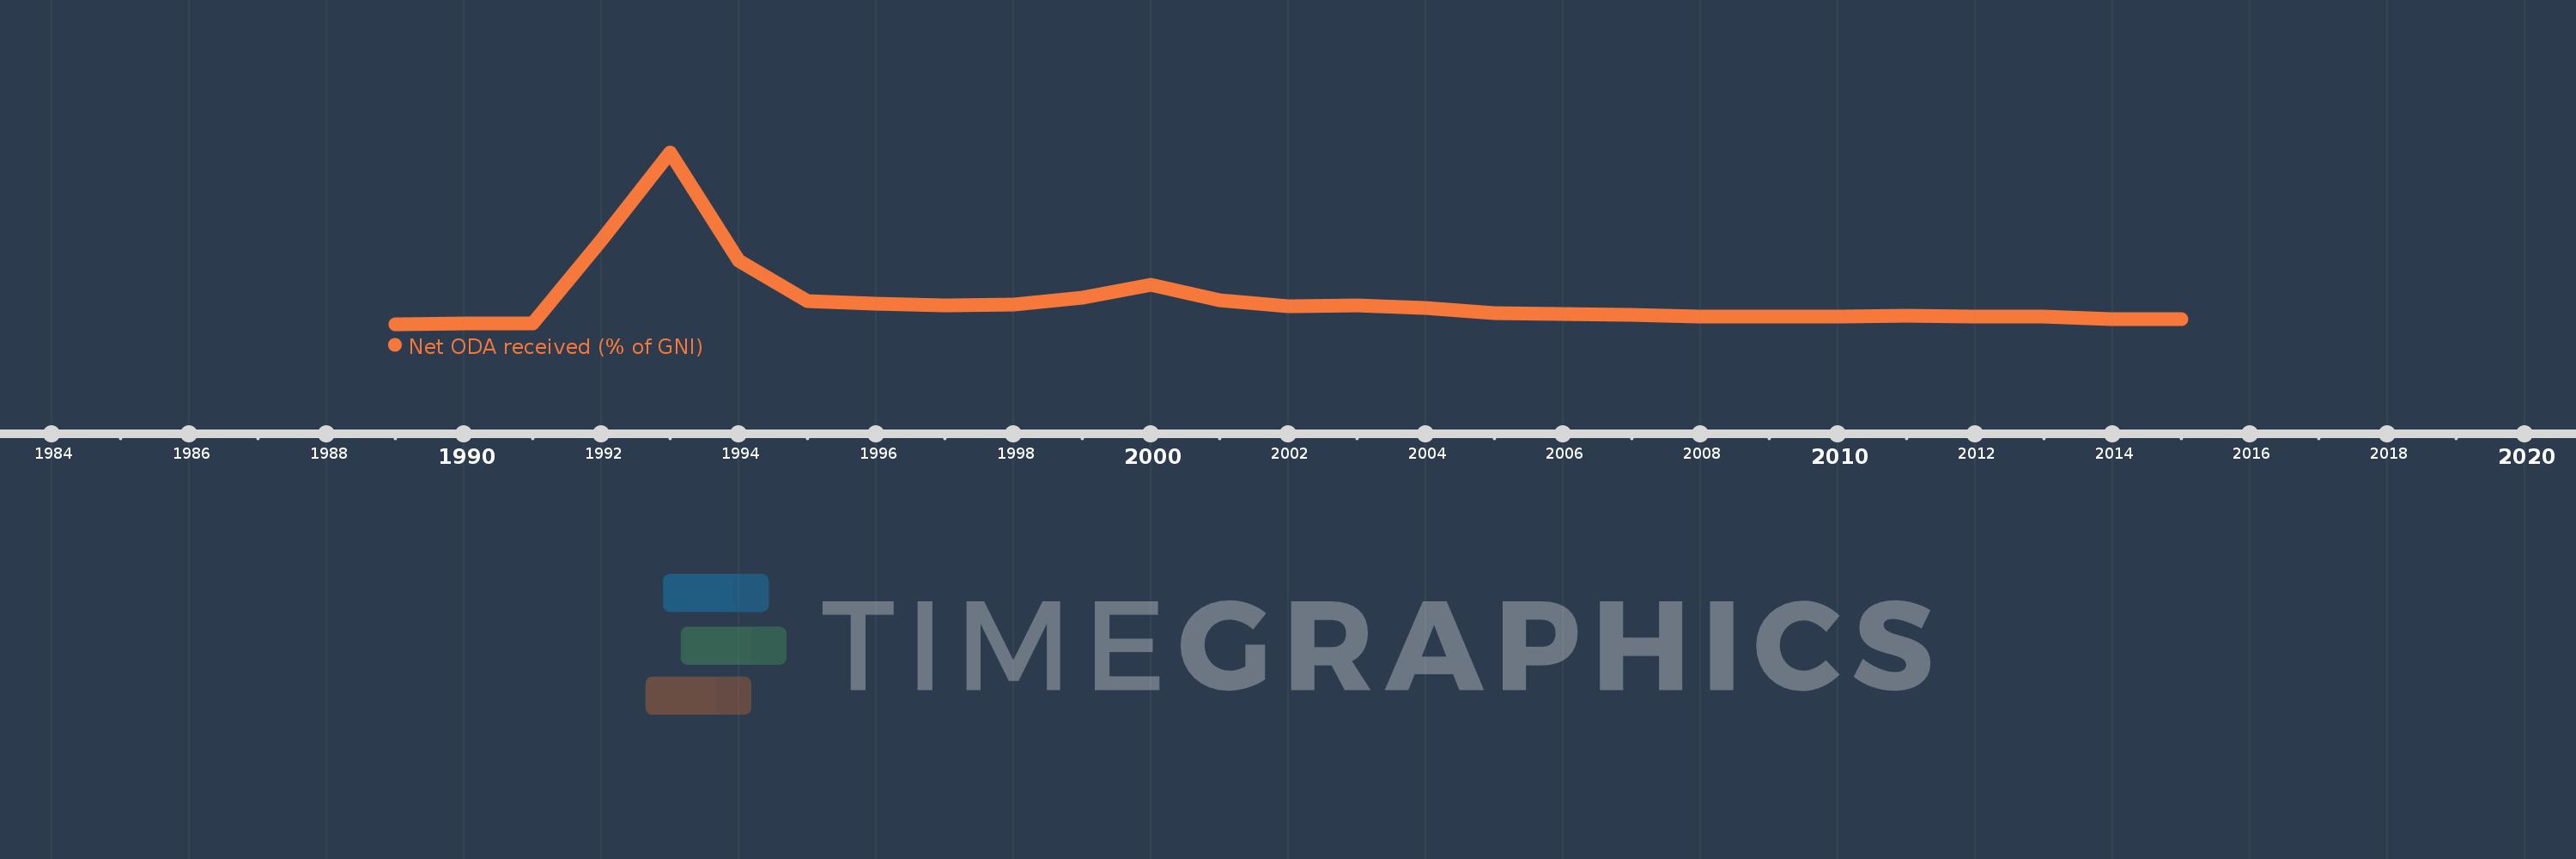
Cette échelle de temps montre un graphique de 1989 année à 2015 année Albania. Les données jusqu'à 1988 année ne sont pas présentés. Quantité d'observations actuelles selon dates: 27.

Source (désignation):

Les indicateurs du développement mondiale

Source (organisation):

Development Assistance Committee of the Organisation for Economic Co-operation and Development, Geographical Distribution of Financial Flows to Developing Countries, Development Co-operation Report, and International Development Statistics database. Data are available online at: www.oecd.org/dac/stats/idsonline. World Bank GNI estimates are used for the denominator.

Catégories:

Aid Effectiveness, Economy & Growth, External Debt

Dernière mise à jour

23 avr. 2017

Les indicateurs de changement de valeurs selon les années

En moyenne:
8.406
Minimum:
0.261
1 janv. 1989
Maximum:
60.182
1 janv. 1993
Pour la date d''observation
Valeur
Changement absolu
Le changement par rapport à la valeur précédente
1 janv. 1989
0.261
+0.261
0.0%
1 janv. 1990
0.443
+0.181
69.34%
1 janv. 1991
0.526
+0.083
18.84%
1 janv. 1992
29.706
+29.179
5.54 milles%
1 janv. 1993
60.182
+30.477
102.6%
1 janv. 1994
22.259
-37.924
-63.01%
1 janv. 1995
8.193
-14.065
-63.19%
1 janv. 1996
7.317
-0.876
-10.69%
1 janv. 1997
6.691
-0.626
-8.56%
1 janv. 1998
6.977
+0.286
4.27%
1 janv. 1999
9.649
+2.673
38.31%
1 janv. 2000
13.985
+4.336
44.93%
1 janv. 2001
8.501
-5.484
-39.21%
1 janv. 2002
6.412
-2.089
-24.57%
1 janv. 2003
6.766
+0.353
5.51%
1 janv. 2004
6.005
-0.761
-11.24%
1 janv. 2005
4.006
-1.999
-33.29%
1 janv. 2006
3.835
-0.171
-4.27%
1 janv. 2007
3.477
-0.358
-9.34%
1 janv. 2008
2.793
-0.684
-19.67%
1 janv. 2009
2.806
+0.013
0.46%
1 janv. 2010
3.012
+0.206
7.33%
1 janv. 2011
3.084
+0.073
2.41%
1 janv. 2012
2.964
-0.121
-3.91%
1 janv. 2013
2.865
-0.099
-3.34%
1 janv. 2014
2.103
-0.761
-26.58%
1 janv. 2015
2.144
+0.041
1.94%

Classement des pays selon les statistiques actuelles par années