29
/fr/
fr
AIzaSyAYiBZKx7MnpbEhh9jyipgxe19OcubqV5w
April 1, 2024
203304
Mozambique
MOZ
true
2
1
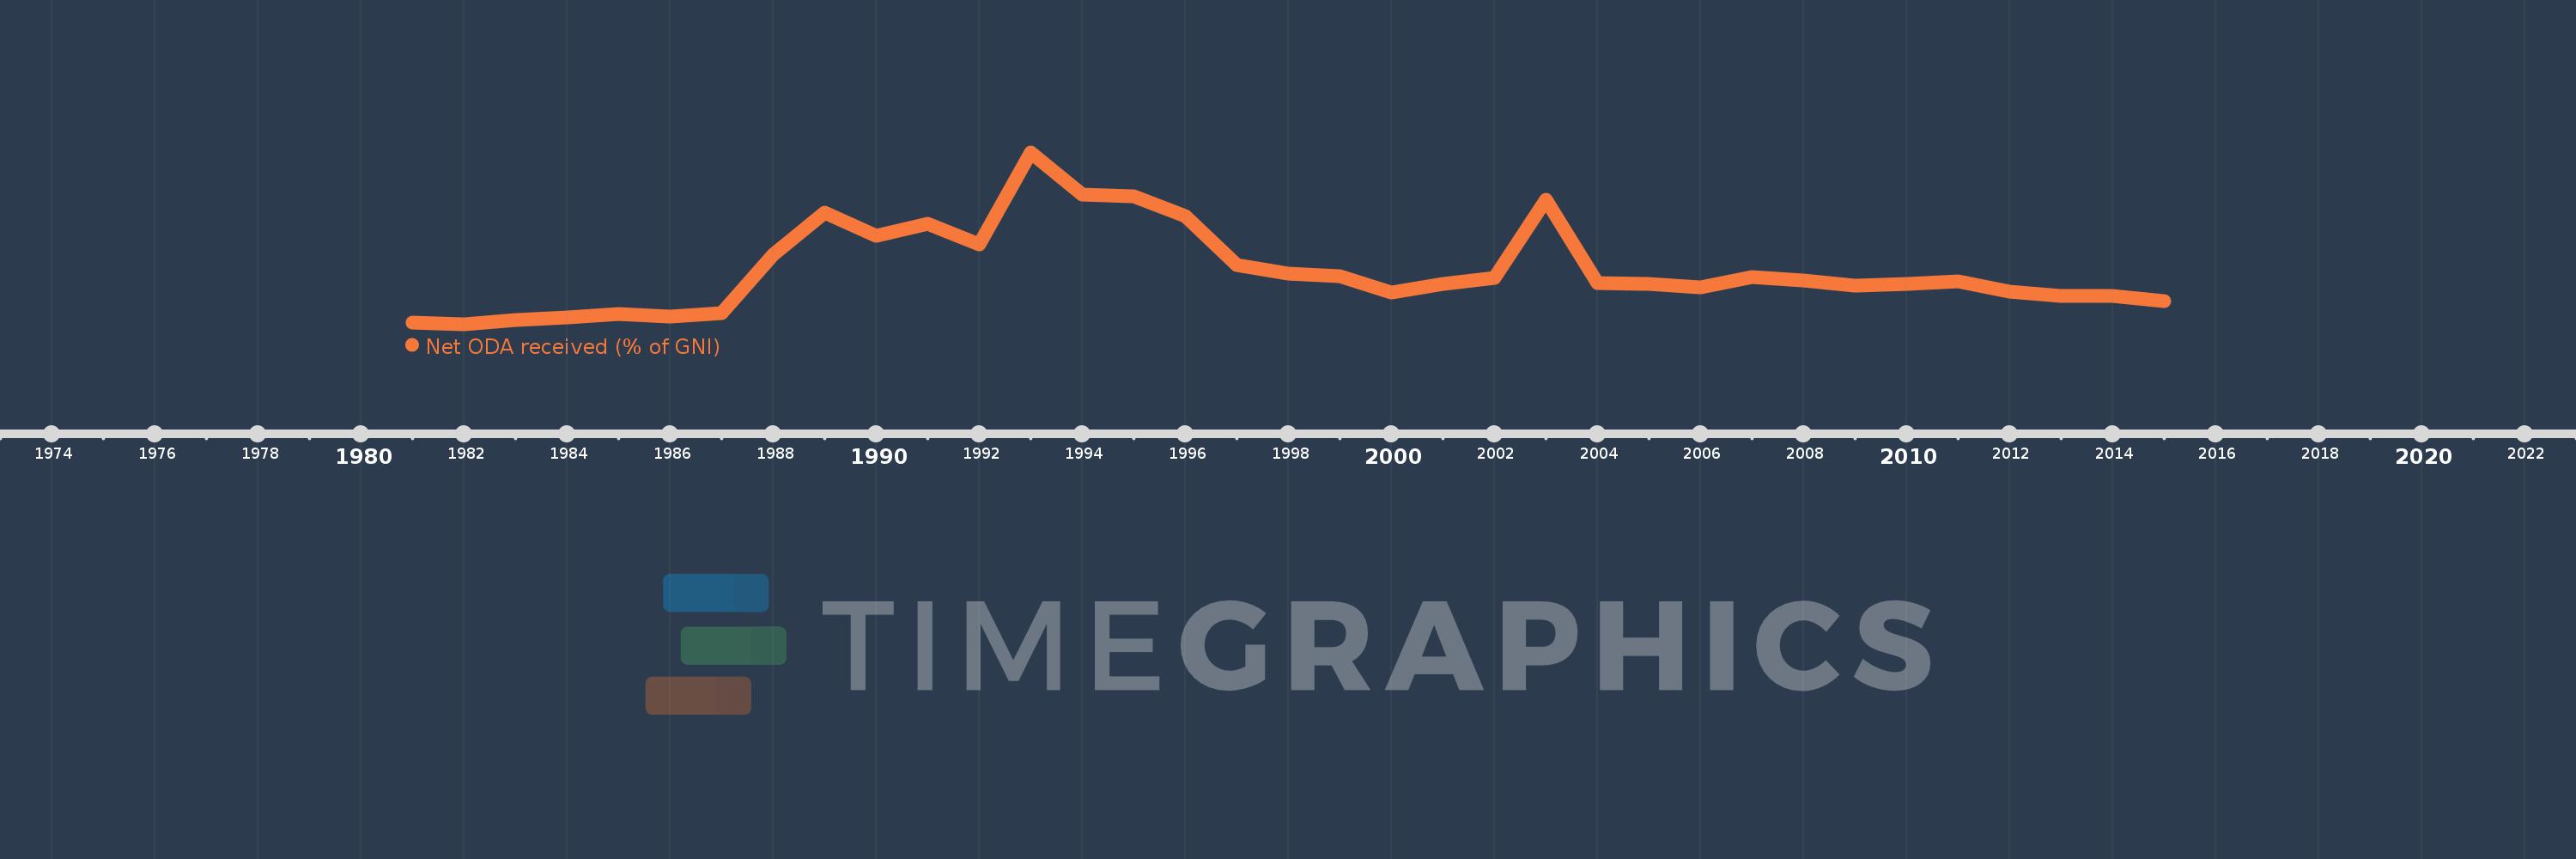
Net ODA received (% of GNI)
2015,2014,2013,2012,2011,2010,2009,2008,2007,2006,2005,2004,2003,2002,2001,2000,1999,1998,1997,1996,1995,1994,1993,1992,1991,1990,1989,1988,1987,1986,1985,1984,1983,1982,1981
Cette statistique dans les autres pays:
AfghanistanAlbaniaAlgeriaAngolaAntigua and BarbudaArab WorldArgentinaArmeniaAzerbaijanBahamas, TheBahrainBangladeshBarbadosBelarusBelizeBeninBermudaBhutanBoliviaBosnia and HerzegovinaBotswanaBrazilBrunei DarussalamBurkina FasoBurundiCabo VerdeCambodiaCameroonCaribbean small statesCentral African RepublicCentral Europe and the BalticsChadChileChinaColombiaComorosCongo, Dem. Rep.Congo, Rep.Costa RicaCote d'IvoireCroatiaCubaCyprusDjiboutiDominicaDominican RepublicEast Asia & PacificEast Asia & Pacific (excluding high income)East Asia & Pacific (IDA & IBRD countries)EcuadorEgypt, Arab Rep.El SalvadorEquatorial GuineaEritreaEthiopiaEuro areaEurope & Central AsiaEurope & Central Asia (excluding high income)Europe & Central Asia (IDA & IBRD countries)European UnionFijiFragile and conflict affected situationsFrench PolynesiaGabonGambia, TheGeorgiaGhanaGrenadaGuatemalaGuineaGuinea-BissauGuyanaHaitiHeavily indebted poor countries (HIPC)High incomeHondurasHong Kong SAR, ChinaIBRD onlyIDA & IBRD totalIDA blendIDA onlyIDA totalIndiaIndonesiaIran, Islamic Rep.IraqIsraelJamaicaJordanKazakhstanKenyaKiribatiKorea, Rep.KosovoKuwaitKyrgyz RepublicLao PDRLatin America & Caribbean Latin America & Caribbean (excluding high income)Latin America & the Caribbean (IDA & IBRD countries)Least developed countries: UN classificationLebanonLesothoLiberiaLibyaLow & middle incomeLow incomeLower middle incomeMacao SAR, ChinaMacedonia, FYRMadagascarMalawiMalaysiaMaldivesMaliMaltaMarshall IslandsMauritaniaMauritiusMexicoMicronesia, Fed. Sts.Middle East & North AfricaMiddle East & North Africa (excluding high income)Middle East & North Africa (IDA & IBRD countries)Middle incomeMoldovaMongoliaMontenegroMoroccoMozambiqueMyanmarNamibiaNauruNepalNew CaledoniaNicaraguaNigerNigeriaNorth AmericaOECD membersOmanOther small statesPacific island small statesPakistanPalauPanamaPapua New GuineaParaguayPeruPhilippinesQatarRwandaSamoaSao Tome and PrincipeSaudi ArabiaSenegalSerbiaSeychellesSierra LeoneSingaporeSloveniaSmall statesSolomon IslandsSomaliaSouth AfricaSouth AsiaSouth Asia (IDA & IBRD)South SudanSri LankaSt. Kitts and NevisSt. LuciaSt. Vincent and the GrenadinesSub-Saharan Africa Sub-Saharan Africa (excluding high income)Sub-Saharan Africa (IDA & IBRD countries)SudanSurinameSwazilandSyrian Arab RepublicTajikistanTanzaniaThailandTimor-LesteTogoTongaTrinidad and TobagoTunisiaTurkeyTurkmenistanTuvaluUgandaUkraineUpper middle incomeUruguayUzbekistanVanuatuVenezuela, RBVietnamWest Bank and GazaWorldYemen, Rep.ZambiaZimbabwe La ligne de temps
Cette échelle de temps montre un graphique de 1981 année à 2015 année Mozambique. Les données jusqu'à 1980 année ne sont pas présentés. Quantité d'observations actuelles selon dates: 35.
Source (désignation):
Les indicateurs du développement mondiale
Source (organisation):
Development Assistance Committee of the Organisation for Economic Co-operation and Development, Geographical Distribution of Financial Flows to Developing Countries, Development Co-operation Report, and International Development Statistics database. Data are available online at: www.oecd.org/dac/stats/idsonline. World Bank GNI estimates are used for the denominator.
Catégories:
Aid Effectiveness, Economy & Growth, External Debt
Dernière mise à jour
23 avr. 2017
Les indicateurs de changement de valeurs selon les années
Minimum:
3.972
1 janv. 1982
Maximum:
67.735
1 janv. 1993
Pour la date d''observation
Valeur
Changement absolu
Le changement par rapport à la valeur précédente
1 janv. 1981
4.708
+4.708
0.0%
1 janv. 1982
3.972
-0.737
-15.65%
1 janv. 1983
5.69
+1.718
43.26%
1 janv. 1984
6.459
+0.77
13.53%
1 janv. 1985
7.662
+1.203
18.62%
1 janv. 1986
6.783
-0.88
-11.48%
1 janv. 1987
8.205
+1.422
20.97%
1 janv. 1988
29.667
+21.462
261.59%
1 janv. 1989
45.309
+15.642
52.73%
1 janv. 1990
36.726
-8.583
-18.94%
1 janv. 1991
41.247
+4.521
12.31%
1 janv. 1992
33.747
-7.5
-18.18%
1 janv. 1993
67.735
+33.989
100.72%
1 janv. 1994
51.945
-15.79
-23.31%
1 janv. 1995
51.495
-0.45
-0.87%
1 janv. 1996
44.031
-7.464
-14.49%
1 janv. 1997
25.812
-18.219
-41.38%
1 janv. 1998
22.867
-2.945
-11.41%
1 janv. 1999
21.918
-0.949
-4.15%
1 janv. 2000
15.805
-6.113
-27.89%
1 janv. 2001
18.787
+2.982
18.87%
1 janv. 2002
21.156
+2.369
12.61%
1 janv. 2003
50.115
+28.96
136.89%
1 janv. 2004
19.293
-30.823
-61.5%
1 janv. 2005
19.026
-0.267
-1.38%
1 janv. 2006
17.615
-1.412
-7.42%
1 janv. 2007
21.352
+3.737
21.21%
1 janv. 2008
20.245
-1.106
-5.18%
1 janv. 2009
18.395
-1.85
-9.14%
1 janv. 2010
18.923
+0.528
2.87%
1 janv. 2011
19.78
+0.858
4.53%
1 janv. 2012
15.956
-3.825
-19.33%
1 janv. 2013
14.308
-1.647
-10.33%
1 janv. 2014
14.503
+0.194
1.36%
1 janv. 2015
12.551
-1.952
-13.46%
Classement des pays selon les statistiques actuelles par années


Commentaires: